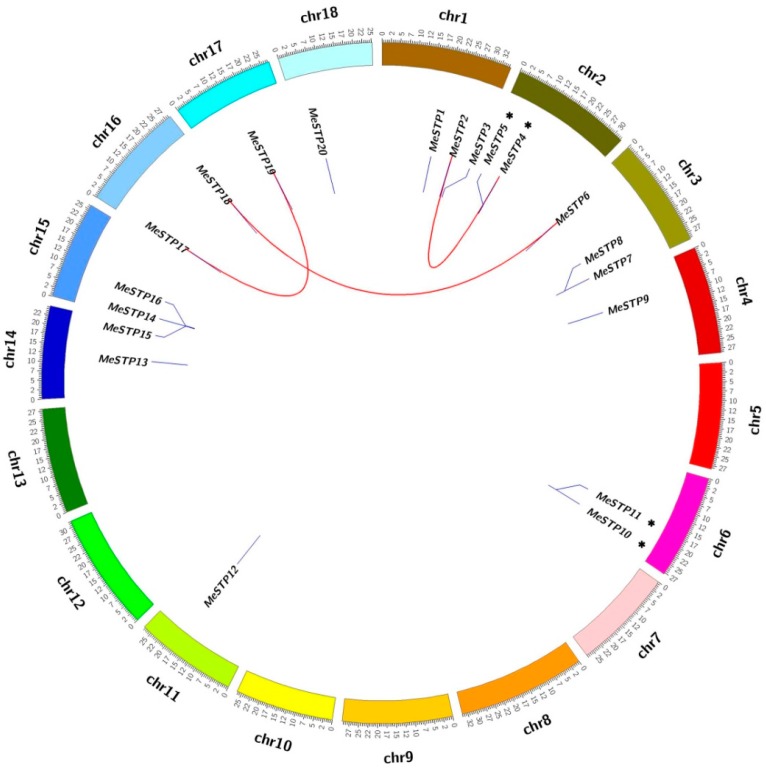
Figure 4.
Chromosomal distribution and gene duplications of the MeSTP genes. The scale on the circle is in Megabases. Each colored bar represents a chromosome as indicated. Gene IDs are labeled on the basis of their positions on the chromosomes. The putative whole genome duplication (WGD) or segmental duplication genes are linked by a red line. Asterisks indicate tandem duplication.

