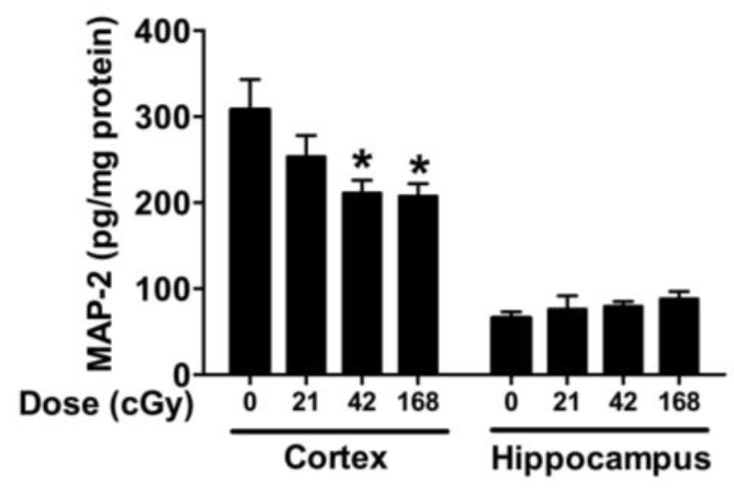
Figure 4.
MAP-2 levels in the cortex and hippocampus. There was a radiation × brain region interaction (F(3,64) = 4.577, p = 0.0058). When the cortex and hippocampus were analyzed separately, in the cortex, there was an effect of irradiation (F(3,32) = 3.827, p = 0.0189, ANOVA) with mice irradiated with 42 or 168 cGy showing lower cortical level of MAP-2 than sham-irradiated mice. In the hippocampus, there was an effect of irradiation (F(3,32) = 4.395, p = 0.01, Brown–Forsythe test), but none of the post hoc tests reached significance. n = 9 mice/radiation condition/brain region. * p < 0.05.

