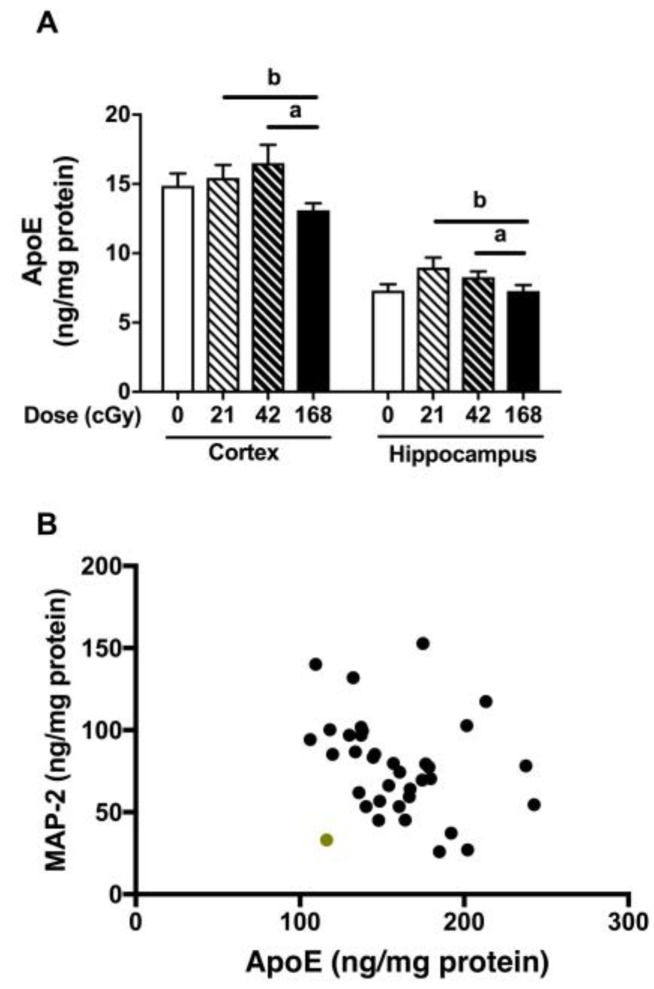
Figure 5.
(A) ApoE levels in the cortex and hippocampus. There was an effect of irradiation on apoE levels (F(3,32) = 3.810, p = 0.019, Figure 5A). ApoE levels were higher in mice irradiated with 42 than 168 cGy (p = 0.035, Bonferroni’s correction for multiple comparisons, indicated by “a” in the figure), and there was a trend towards higher apoE levels in mice irradiated at 21 than 168 cGy (p = 0.065, Bonferroni’s correction for multiple comparisons, indicated by “b” in the figure). (B) Relationship between hippocampal MAP-2 and apoE levels (r = −0.3277, p = 0.0511, two-tailed Spearman correlation, 36 data points). Inspecting the data, there was one data point that seemed removed from the other ones (indicated in green). Therefore, we also performed the analysis without that data point included. The analysis without that data point revealed: r = −0.4123, p = 0.0138, Spearman correlation, 35 data points.

