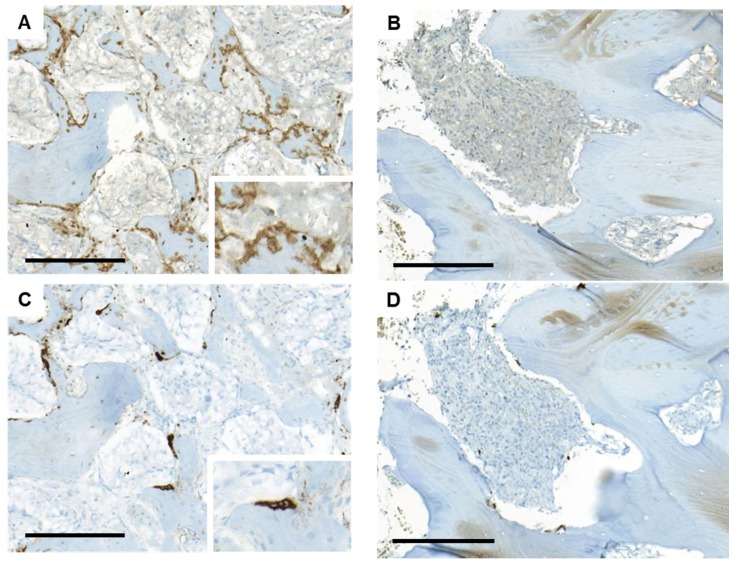
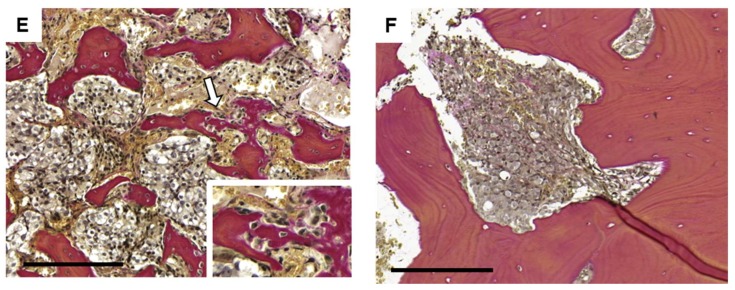
Figure 3.
Representative immunostaining of runt-related transcription factor 2 (A,B), tartrate-resistant acid phosphatase (C,D) and van Gieson (E,F) in metastatic lesions with high (A,C,E) and low (B,D,F) bone cell activity. The area with newly formed bone is indicated with an arrow and magnified (E). Bar indicates 200 µm.


