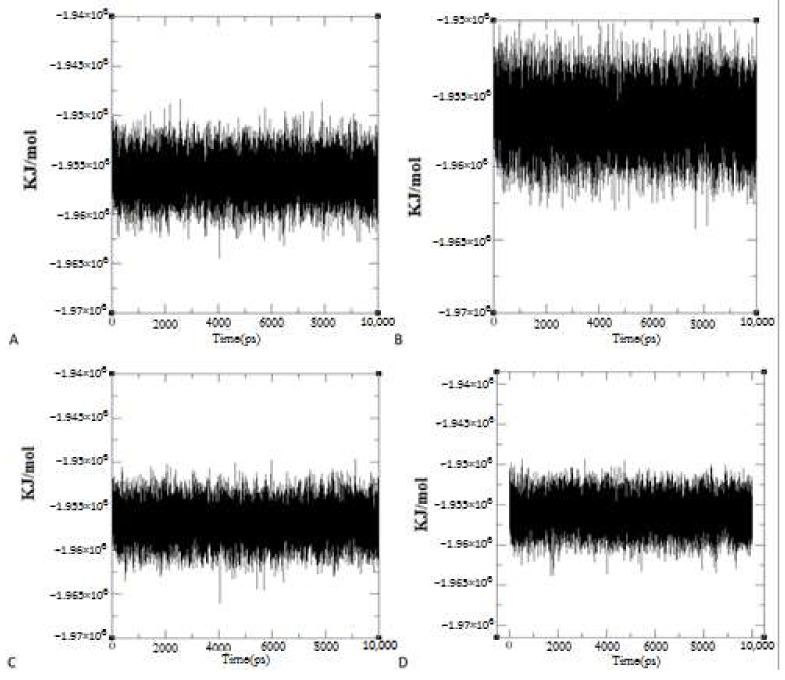
Figure 3.
Energy of systems during 10 ns molecular dynamics simulations. Charts of Energy Changes in Protein-Ligand Complex Systems between (A) TERT and boldine and (B) TERT and BSB, during trajectories from focused docking poses in the Molecular Dynamics simulations. Charts of Energy Changes in Protein-Ligand Complex Systems between (C) TERT and boldine and (D) TERT and BSB during trajectories from blind docking poses in the Molecular Dynamics Simulations.

