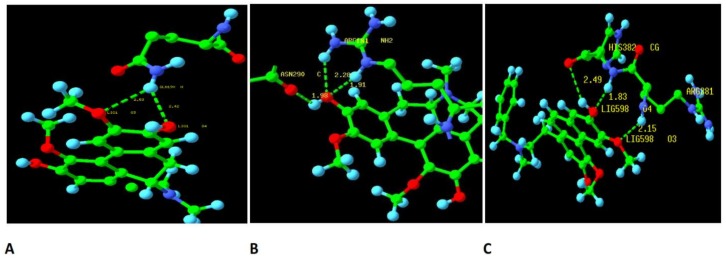
Figure 5.
The hydrogen bond plot after 10 ns molecular dynamics simulations between (A) boldine (initial structure obtained after focused docking screen) in complex with TERT; (B) boldine (initial structure obtained after blind docking screen) in complex with TERT; (C) BSB (initial structure obtained after focused docking screen) in complex with TERT. The carbon, nitrogen, oxygen and hydrogen atoms were shown in green, blue, red and light blue colors, respectively.

