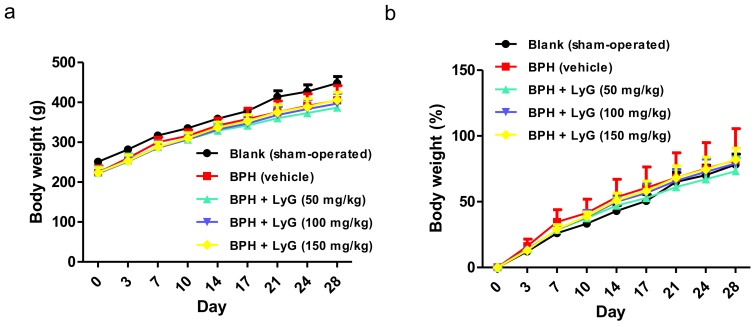
Figure 3.
Body weight of BPH-induced rats who had an oral administration of Lycogen™ (LyG). (a) The mean body weight of each group and (b) the mean body weight normalized to the control of each group that were exhibited for BPH-induced rats during the period of Lycogen™ administration. The data were presented as mean ± SD. Blank: sham-operated; BPH: BPH-induced rats; BPH + LyG: BPH-induced rats combined with a Lycogen™ (LyG) treatment (50, 100 and 150 mg/kg).

