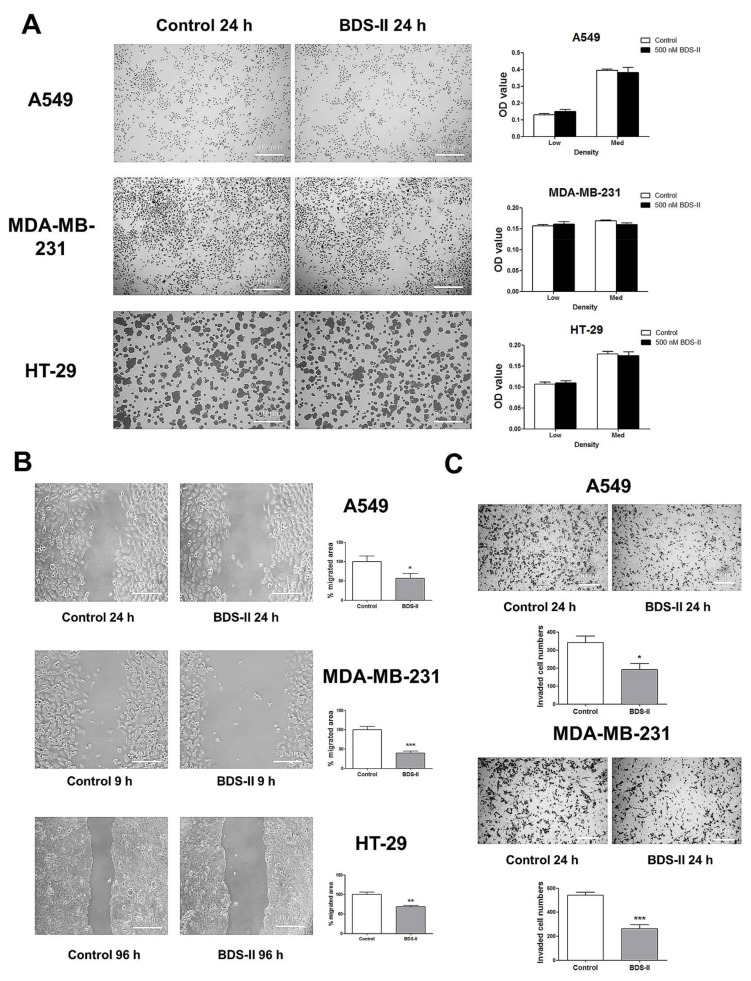
Figure 4.
Effect of BDS-II on cell proliferation, migration, and invasion. (A) Representative Hemacolor® rapid staining images demonstrate that 24 h of BDS-II (500 nM) treatment did not affect the proliferation of A549, MDA-MB-231, and HT-29 cells. The MTT data also demonstrated that BDS-II did not affect cell proliferation in the three cell lines. (B) Representative images demonstrate that 500 nM BDS-II significantly inhibited migration by almost half in A549, MDA-MB-231, and HT-29 cells. (C) Hemacolor® rapid staining images demonstrate that the number of cells that migrated through the membrane was reduced in A549 and MDA-MB-231 cells by 500 nM BDS-II treatment. All experiments were performed in triplicate or quadruplicate, and the data represent the mean ± standard error. * p < 0.05, ** p < 0.01, and *** p < 0.001 versus the control value.

