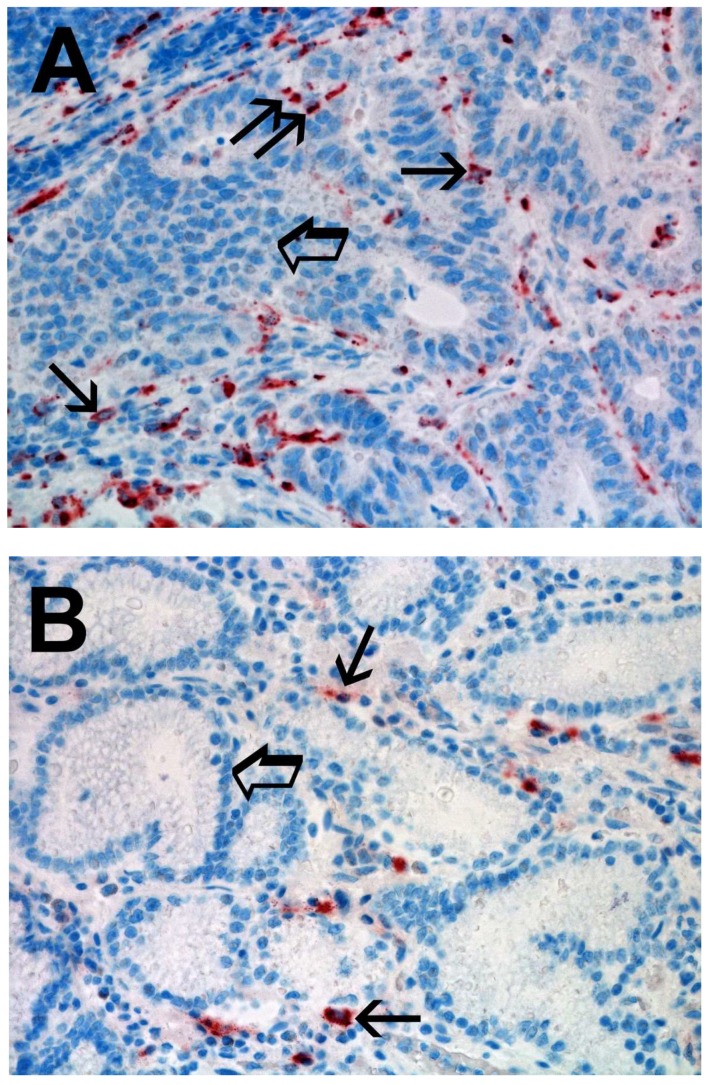
Figure 2.
(A) High TAMs count in primary gastric cancer tissue section immunostained with the anti-CD68 antibody. Small arrows indicate single red stained macrophages. Big arrow indicates tumoral epithelium. Magnification ×400 (0.19 mm2 area). (B) Low TAMs count in adjacent normal tissue section immunostained with the anti-CD68 antibody. Small arrows indicate single red stained macrophages. Big arrow indicates normal gastric epithelium. Magnification ×400 (0.19 mm2 area).

