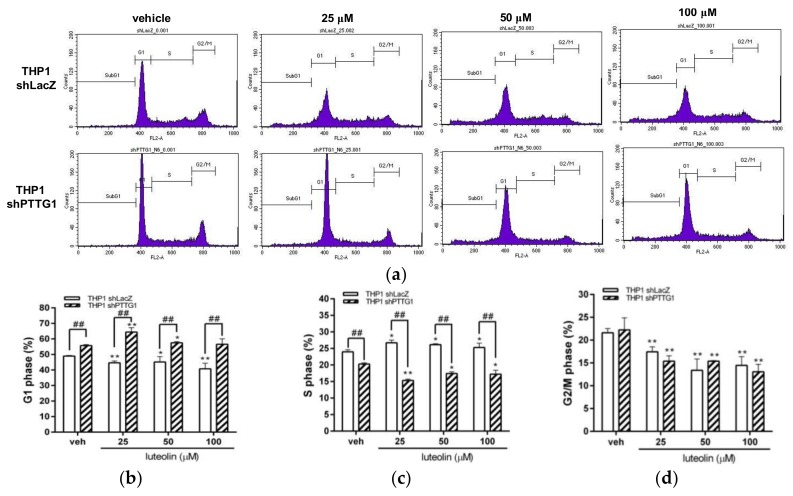
Figure 6.
Effects of luteolin on cell-cycle distribution in PTTG1-knockdown cells. The THP1 shLacZ and shPTTG1 cells were treated with vehicle or luteolin (25–100 μM) for 24 h. (a) The cell-cycle distribution was determined by flow cytometric analysis. The experiments were replicated three times. A representative histogram is shown. Cell populations in the (b) G1 phase (c) S phase (d) G2/M phase were quantified. The experiments were replicated at three times. The data are presented as the means ± SD from three independent experiments. * p < 0.05 and ** p < 0.01 indicate a significant difference compared to the vehicle group (veh). ## p < 0.01 represents a significant difference compared to the THP1 shLacZ control cells.

