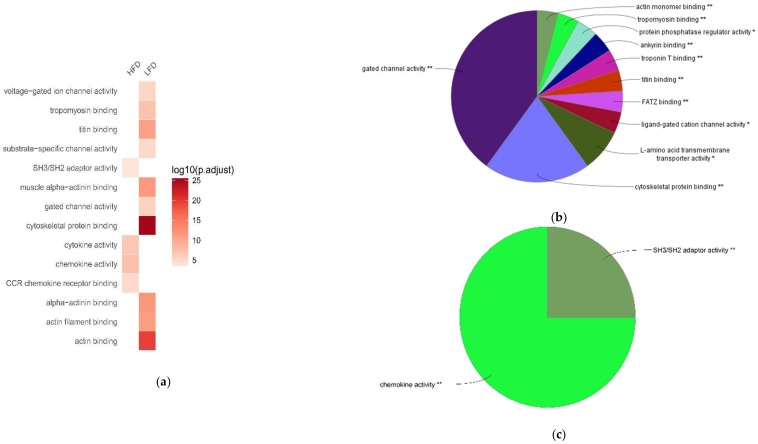
Figure 4.
Comparing top Gene Ontology (GO) molecular function (MF) terms associated with high-fat diet (HFD)-responsive genes in brown adipose tissue (BAT). Enrichment analysis was performed using differentially expressed genes in BAT between HFD and low-fat diet (LFD) groups. (a) Heat-map showing top GO MF annotation terms in the BAT between HFD and LFD groups. (b) GO MF terms associated with downregulated genes in BAT of HFD-fed obese mice. (c) GO MF terms associated with upregulated genes in BAT of HFD-fed obese mice.

