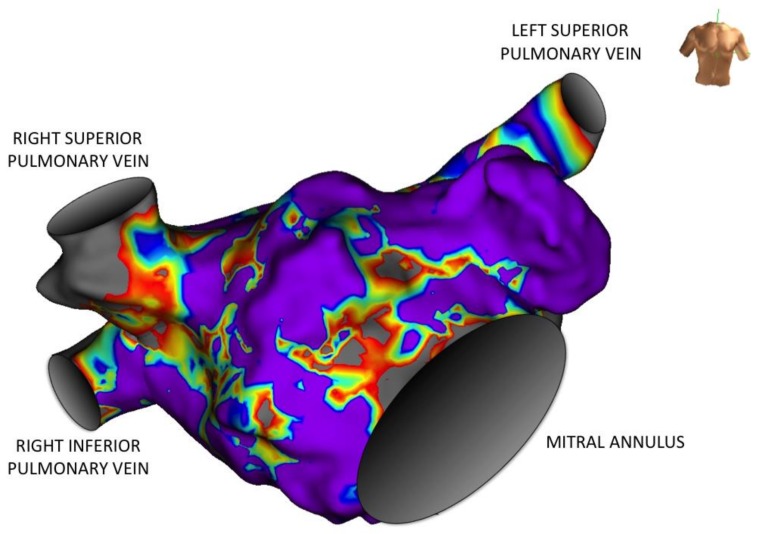
Figure 1.
Three-dimensional voltage map of the left atrium obtained during invasive electrophysiological mapping (anterior view). The amplitude of local electrical activity is color-coded: from grey for low voltage areas to mauve for high voltage areas. Local amplitude correlates to the underlying atrial myocardial thickness, so that fibrotic areas translate into low voltage heterogeneous (“patchy”) anisotropic areas, here localized on the inter-atrial septum and the anterior wall.

