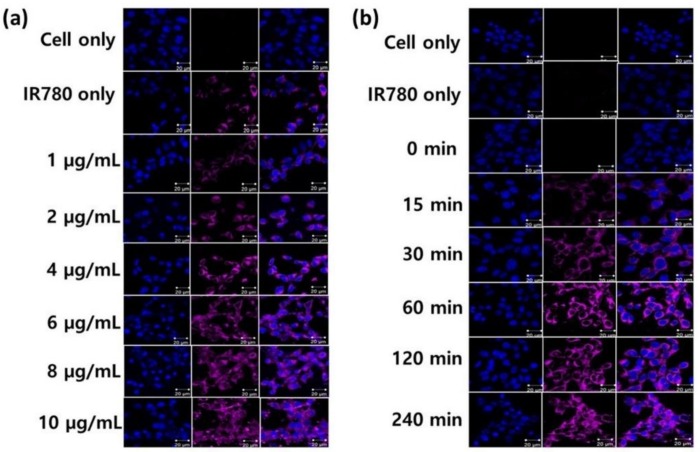
Figure 5.
Intracellular uptake of PCB-lipid–IR-780 NPs in the TC-1 cell line. (a) NIR fluorescent image of TC-1 cells treated with PCB-lipid–IR-780 NPs at different concentrations and (b) NIR fluorescent image of TC-1 cells treated with PCB-lipid–IR-780 NPs (8 µg/mL IR-780) at different time points. Scale bar, 20 µm.

