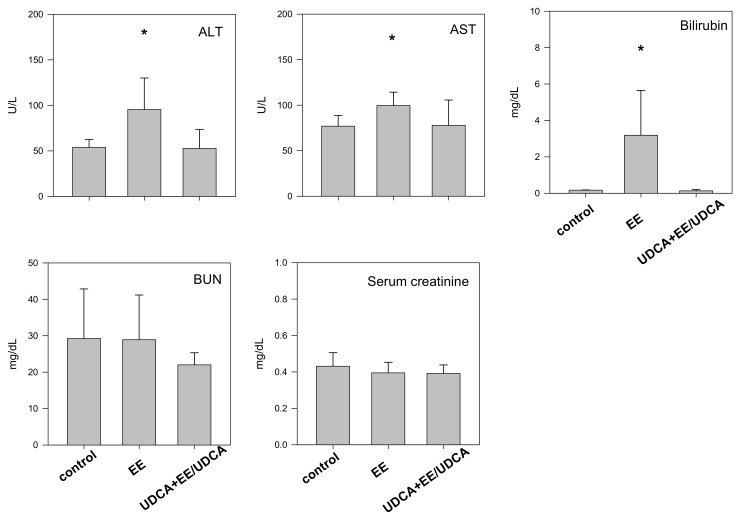
Figure 1.
Biochemical parameters such as alanine aminotransferase (ALT), aspartate aminotransferase (AST), bilirubin, blood urea nitrogen (BUN) and serum creatinine level in control, EE and UDCA + EE/UDCA group. Each bar represents the mean ± SD from three different rats per group. * p < 0.05, significant compared with control group by student’s t-test.

