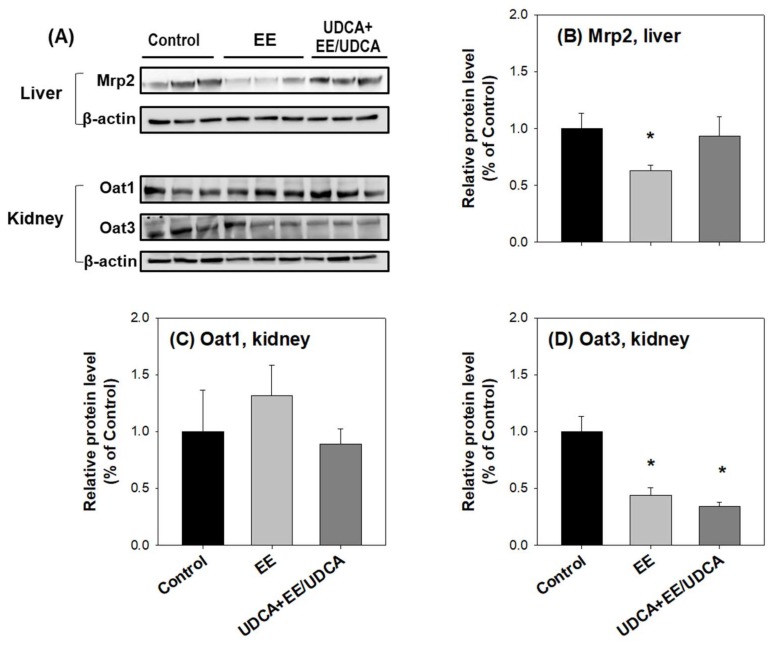
Figure 4.
(A) Protein expression level of Mrp2 in the liver and levels of Oat1 and Oat3 in the kidney from control, EE and UDCA + EE/UDCA groups. (A) Lanes were loaded tissue lysates, which was prepared from three different rats per group. β-actin served as a loading control. Quantitative analyses of the western blot results are shown in (B–D). Each bar represents the mean ± SD. * p < 0.05, significant compared with control group by student’s t-test.

