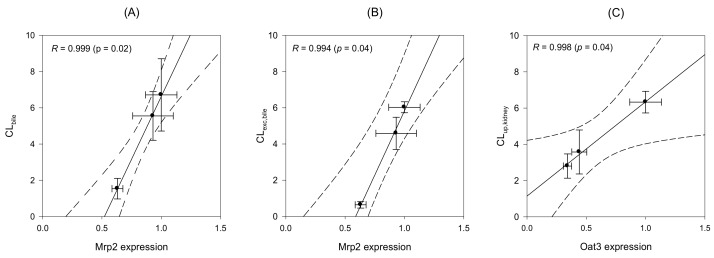
Figure 5.
Correlation between Mrp2 protein expression and in vivo CLbile (A) and CLexc,bile (B) and between Oat3 protein expression and CLup,kidney (C) of MTX. Mrp2 and Oat3 expression levels were recorded from the western blot analysis in Figure 4 and in vivo CL of MTX were selected from Table 3, Table 4 and Table 5. Lines were generated from the linear regression analysis and dotted lines represent 95% confidence interval from the geometric mean value.

