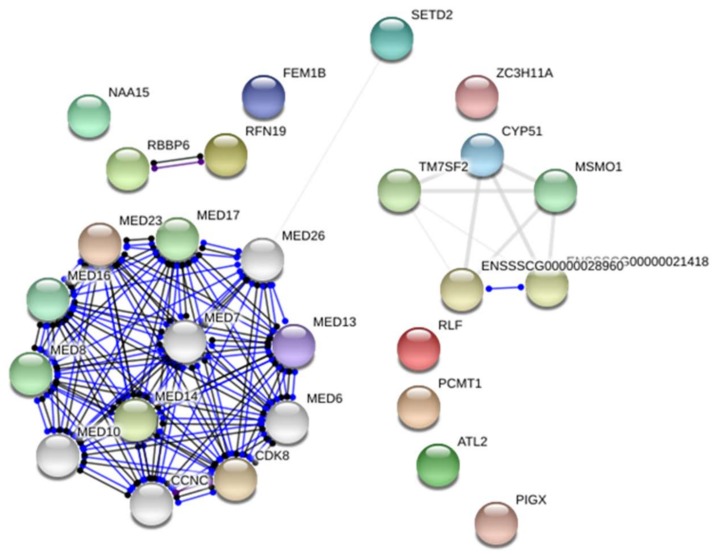
Figure 2.
The differentially expressed genes were down-regulated in muscles of pigs with higher muscle mass. Detected genes were coloured and showed no more than 20 interactions (genes marked in grey); line shape indicates the predicted mode of action. Lines coloured indicate the predicted mode of action (blue—interactions from curated databases; black—co-expression). Network were presented as a scalable vector graphic and based on Sus scrofa reference.

