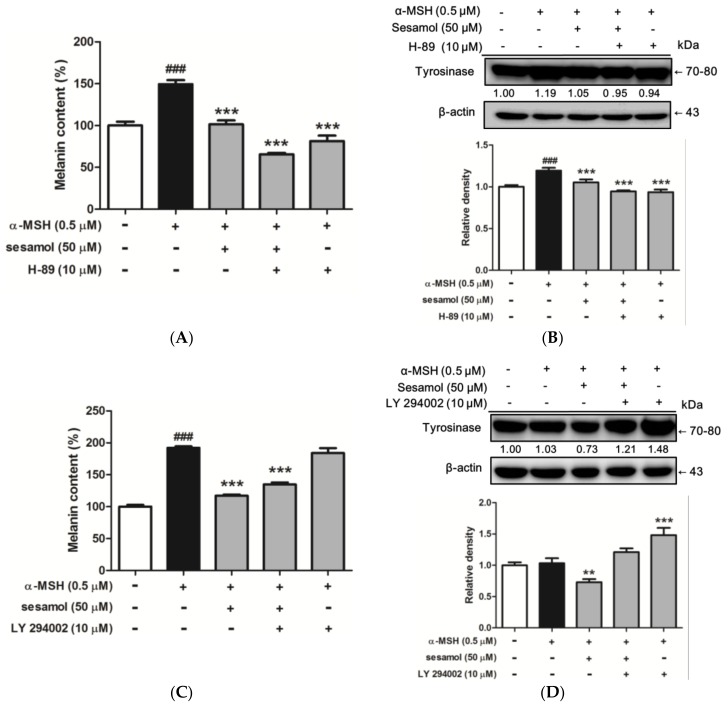
Figure 7.
(A) Effect of sesamol and H-89 (PKA/MSK inhibitor) on melanin content (%) in α-MSH-treated B16F10 cells after 48 h. Each value is presented as the mean ± SD. ### p < 0.001 (Significant difference versus control); *** p < 0.001 (Significant difference versus α-MSH treated group). (B) Effects of sesamol and H-89 (PKA/MSK inhibitor) on protein expression of tyrosinase in α-MSH-treated B16F10 cells after 48 h. Each value is presented as the mean ± SD. ### p < 0.001 (Significant difference versus control); *** p < 0.001 (Significant difference versus α-MSH treated group). (C) Effects of sesamol and LY 294002 (PI3K inhibitor) on melanin content (%) in α-MSH-treated B16F10 cells after 48 h. Each value is presented as the mean ± SD. ### p < 0.001 (Significant difference versus control); *** p < 0.001 (Significant difference versus α-MSH treated group). (D) Effects of sesamol and LY 294002 (PI3K inhibitor) on protein expression of tyrosinase in α-MSH-treated B16F10 cells after 48 h. Each value is presented as the mean ± SD. ** p < 0.01, *** p < 0.001 (Significant difference versus α-MSH treated group).

