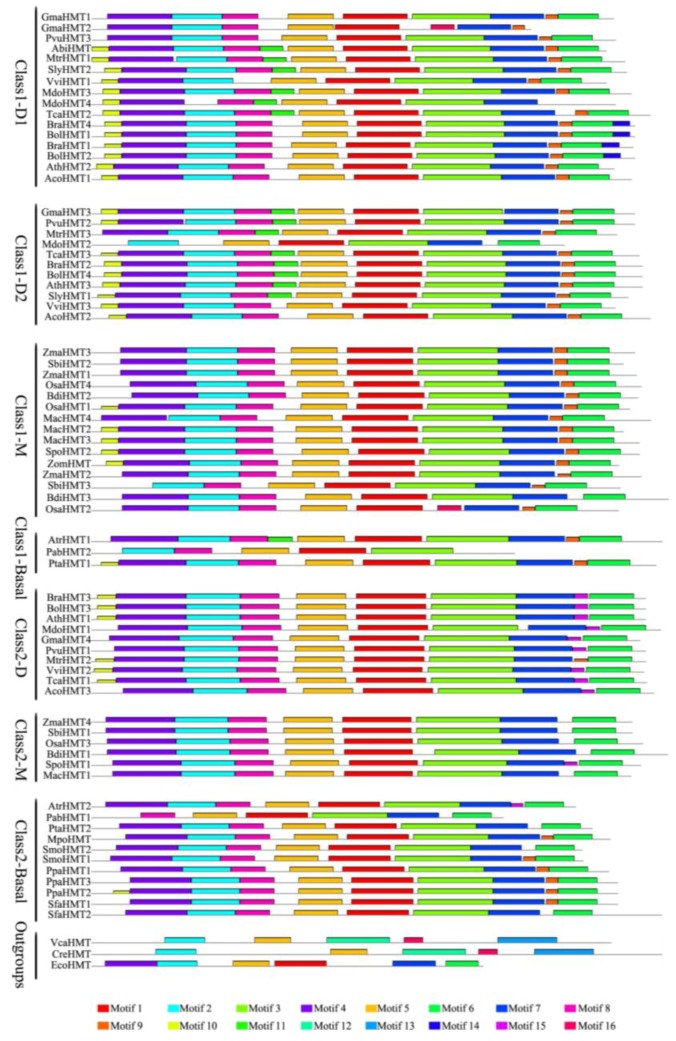
Figure 2.
Conserved motifs of HMT proteins identified on the MEME analysis across plants. Each motif is represented by a colored box numbered on the bottom. The amino acid sequences of these motifs are presented in Figure S1 in Additional file 3. The black lines represent unique sequences. The scale bar indicates number of amino acids. Names to the left indicate the clades to which the sequences belong to according to Figure 1.

