Figure 2.
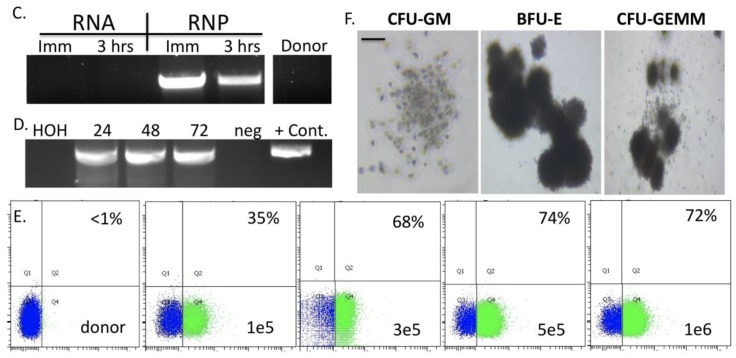
Genome editing optimization in human hematopoietic stem and progenitor cells. (A) Hematopoietic stem cell phenotyping. CD34 cells were isolated from cord blood and analyzed for CD34 and CD133, markers of hematopoietic lineage stem cells; (B) Gene editing experimental schema. Cas9 was delivered, via electroporation, to human cord blood derived CD34+ cells as mRNA with a guide RNA with phosphorothioate modifications or as a recombinant peptide with a gRNA without modification. Adeno-associated virus (AAV) serotype 6 was used to deliver a homology directed repair template for the PPP1R12C gene on chromosome 19. The homologous recombination repair reporter is shown in relation to the PPP1R12C target locus. The donor contains donor arms to the PPP1R12C locus that flank a splice acceptor (SA), 2A sequence, green fluorescent protein gene (GFP), and the bovine growth hormone polyadenylation signal (pA). Insertion into the first intron results in splicing into the reporter with subsequent GFP expression. Green boxes represent exons. (C) Molecular readout for homologous recombination. AAV-6 donor was added to cells that were electroporated with Cas9 mRNA or protein immediately after gene transfer (imm) or 3 h post electroporation. HDR analysis was done at 72 h using an “inside-out” PCR with one primer inside the donor and the second located at the endogenous locus (arrows in (B)). (D) Homology directed repair temporal kinetics. Cas9 RNP was electroporated into CD34 cord blood cells and AAV-6 donor (multiplicity of infection (MOI) 5e5 GC/mL) was added immediately after gene transfer. Cells were screened for HDR by allele specific inside/out PCR at 1, 2, or 3 days after donor delivery. (E) HDR donor template dose optimization. Various donor concentrations were added as AAV-6 particles at the indicated multiplicity of infection (lower right quadrant of FACS plot). At 72 h post modification flow cytometry was performed to assess GFP expression from the donor. Percentage of GFP positive cells are shown in each box. (F) Representative images of MethoCult colony forming unit assay. CFU-GM = granulocyte/macrophage, BFU-E = burst forming unit-erythroid CFU-GEMM = granulocyte, erythrocyte, monocyte, megakaryocyte. All data are representative of at least three experiments. HOH = water; neg = negative control, untreated cells; +Cont = K562 cells that were generated for use as a positive control. Black bar is 100 microns and photomicrographs were taken at 400× magnification.


