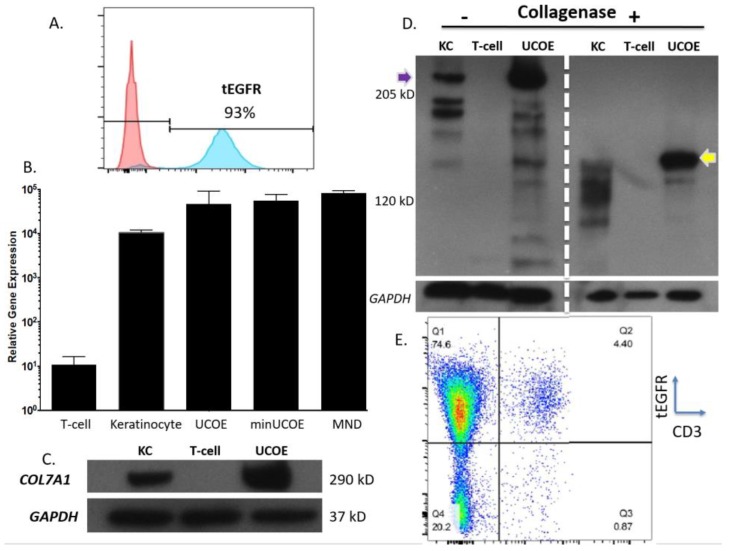
Figure 5.
COL7A1 promoter targeted T-cell characterization. (A) tEGFR-based cell purification. Cells were purified by magnetic sorting to a purity of >90% (blue portion of histogram). Pink part of FACS plot shows negative, unstained cells. (B) Transcriptional activation rates. Cells with >90% tEGFR purity were analyzed by qRT-PCR for COL7A1 expression. Controls were un-manipulated T-cells and wild type keratinocytes. p = 0.08 for UCOE vs. minUCOE, p = 0.03 for minUCOE vs. MND, and p = 0.69 for UCOE vs. MND. n = 3–4 for all analyses. (C,D) Protein analysis. Lysates were taken from UCOE modified cells for Western blot with an anti-C7 antibody that detects full length peptide (C). Lysates were subjected to collagenase digestion that fragments the peptide into the constituent non-collagenous domains and the yellow arrow shows the 145 kD NC1 domain. Purple arrow shows the full length ~270 kD peptide. Loading controls are GAPDH for each. Wild type keratinocytes (KC) were the positive control and untreated T-cells were the negative control. Molecular weight marker indications are shown at left. (E) TRAC gene disruption. A second engineering step with electroporation of a TRAC gRNA Cas9 RNP resulted in ~95% TCR loss (x-axis is CD3 antibody staining) with >80% tEGFR (y-axis). FACS plot is representative of three experiments. Densitometry was performed on n = 3 gels for figure C and averaged 2.7 fold ± 0.5).

