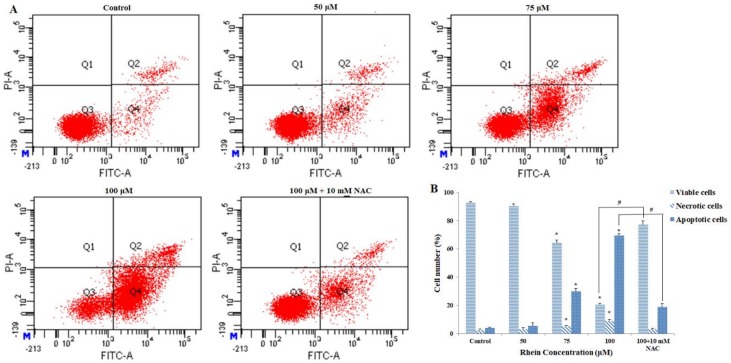
Figure 3.
HepaRG cells were treated with various concentrations of rhein (0, 50, 75, 100 μM) for 24 h. (A) Annexin V-FITC/PI double staining was performed using a flow cytometer. (B) Column bar graph of the mean cell fluorescence for viable, apoptotic, and necrotic cells. The total percentage of apoptotic cells is expressed as the summation of both early and late apoptosis subpopulations. Results are the mean ± S.D. (n = 3). LSD t-test was carried out. * p < 0.05, significantly different compared with vehicle control. # p < 0.05, significantly different compared with rhein 100 μM-treated group.

