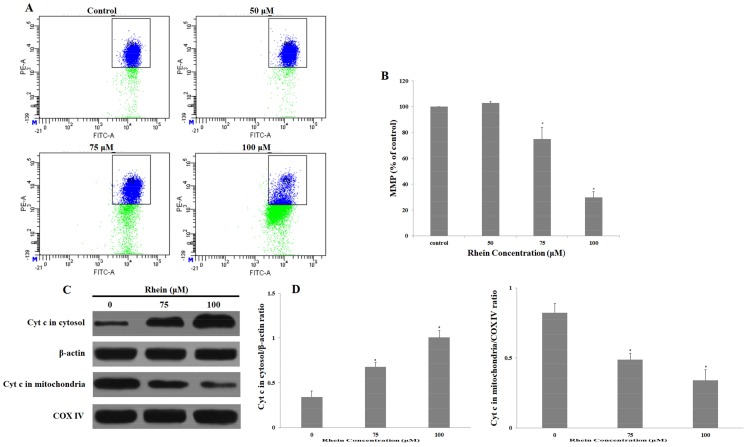
Figure 5.
Depolarization of the mitochondrial membrane in HepaRG cells induced by different concentrations of rhein for 24 h. (A) The proportion of cells with MMP were stained by 5,5′,6,6′-tetrachloro-1,1′,3,3′-tetraethylbenzimidazolylcarbocyanine iodide (JC-1) dye and measured by flow cytometry; (B) Histogram of the average cell fluorescence of JC-1; (C) Expression of cytochrome c in the mitochondria and cytosol were determined by Western blotting. β-actin and COX IV expression levels served as an internal control in the cytoplasmic and mitochondrial fractions, respectively; (D) Quantity One software was used to quantify these protein-related bands. Results are the mean ± S.D. (n = 3). LSD t-test was carried out. * p < 0.05, significantly different compared with vehicle control.

