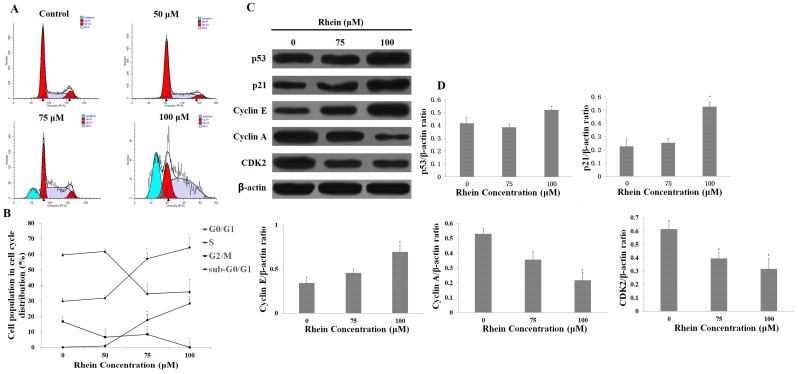
Figure 6.
Flow cytometry was used to detect the effect of rhein on the cell cycle distribution of HepaRG cells. (A) Rhein induced S phase arrest after treatment with various concentrations of rhein for 24 h; (B) Each phase of the cell cycle is displayed in the histogram; (C) The expression levels of cell cycle-regulated proteins were determined by Western blotting. The β-actin was used as a loading control; (D) Quantity One software was used to quantify these protein-related bands. Results are the mean ± S.D. (n = 3). LSD t-test was carried out. * p < 0.05, significantly different compared with vehicle control.

