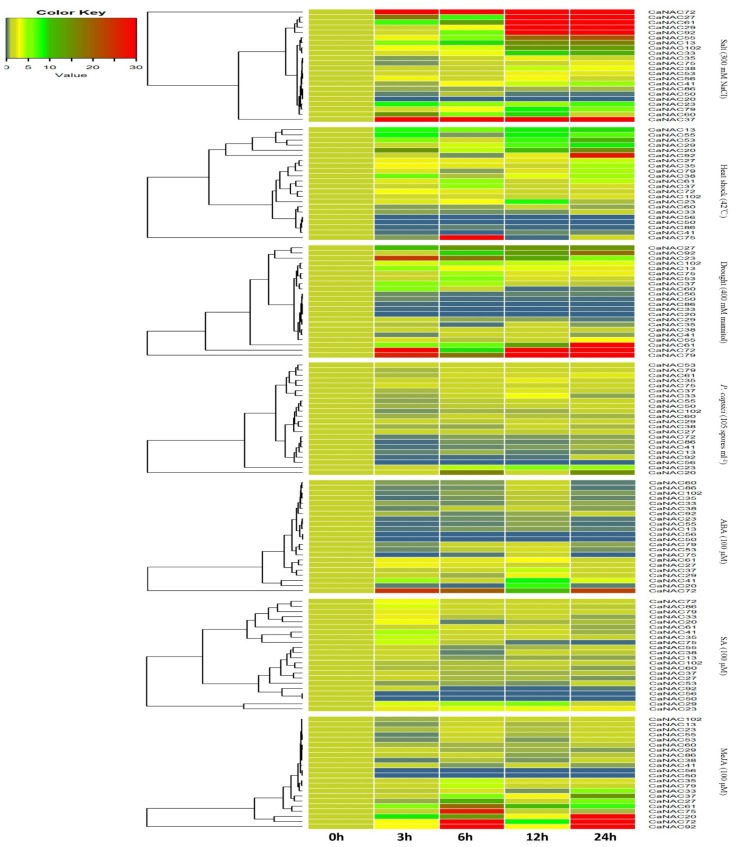
Figure 5.
Heat map showing CaNAC genes expression pattern in pepper under seven different types of stress. The leaves or roots of the seedlings (six true leaves) were used to test the changes of CaNAC gene expression levels using real-time PCR at different timepoints (0, 3, 6, 12 and 24 h) with salt, heat shock, abscisic acid (ABA), salicylic acid (SA), methyl jasmonate (MeJA), drought, and Phytophthora capsici treatment, respectively. Actin1 was used as an internal control. qRT-PCR data are shown relative to 0 h. The relative expression levels were calculated using the 2(−∆Ct) method. The heat map was created using R language.

