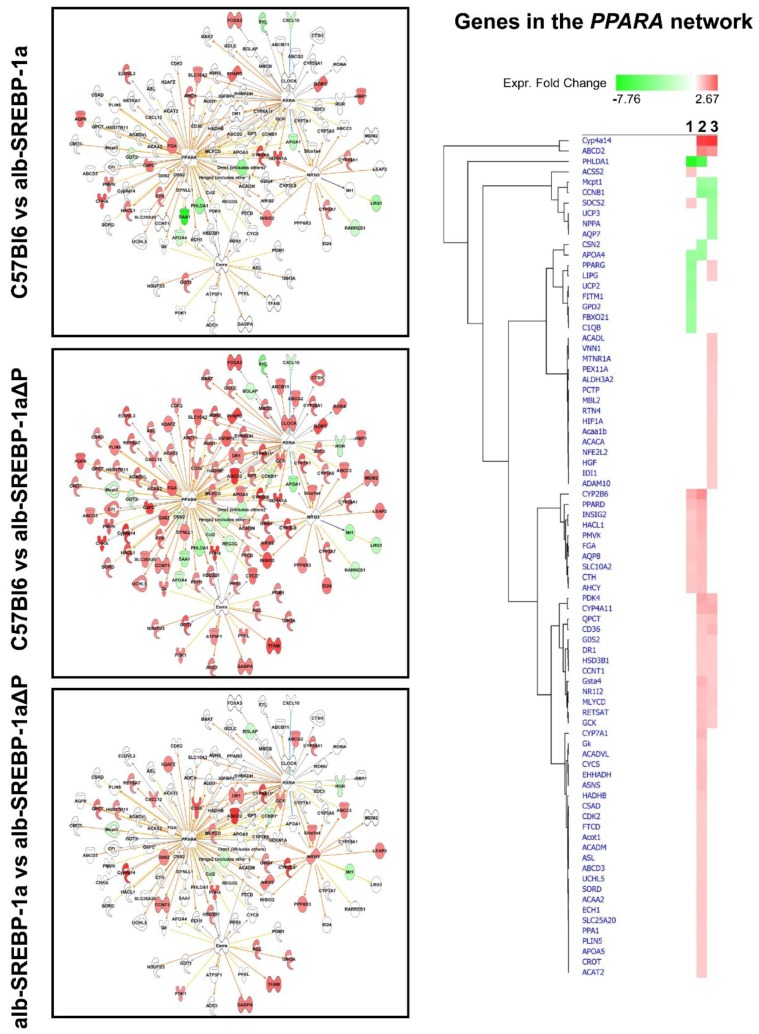
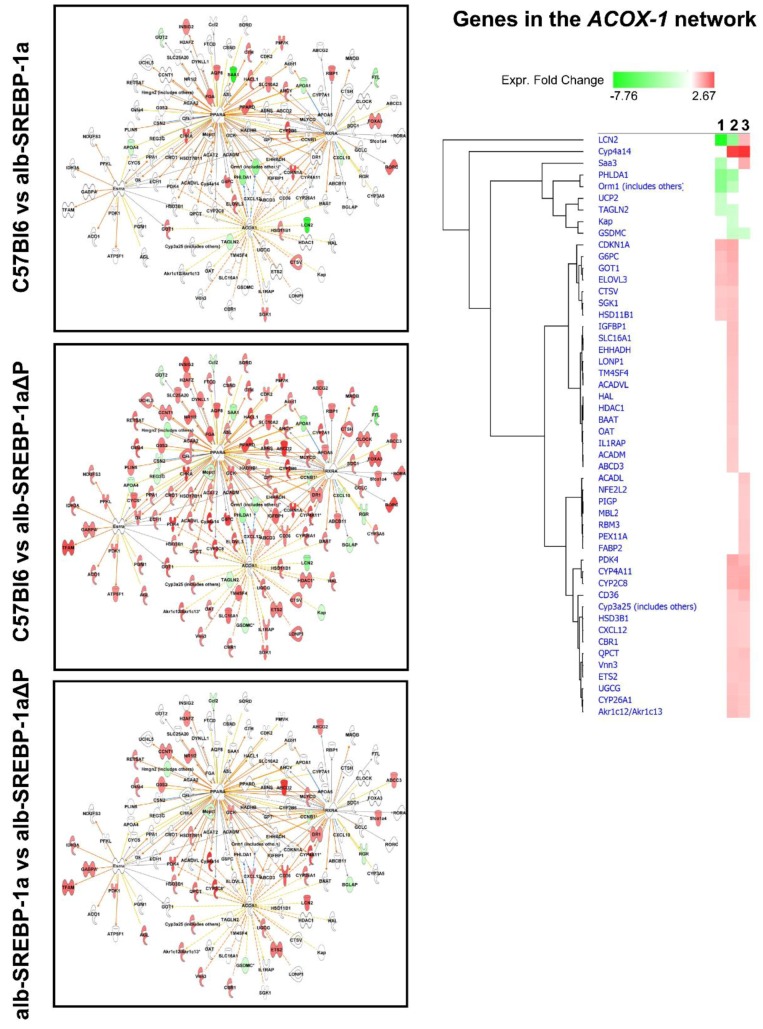
Figure 5.
Overlap of the differential hepatic gene expression of the comparisons C57Bl6 vs. alb-SREBP-1a, C57Bl6 vs. alb-SREBP-1a∆P, and alb-SREBP-1a vs. alb-SREBP-1a∆P to interaction networks centered to PPARA or ACOX-1. Genes with differential gene expression (1.5-fold, p-value < 0.05) were used for IPA core analyses. Color code indicates knowledge-based interpretation (amber: predicted activation, blue: predicted inhibition, yellow: inconsistence with state of downstream molecule, black: effect not predicted) and different abundance (red: increase in condition 1, green: decrease in condition 1) based on measured expression. Different abundance of network genes is indicated in detail in the hierarchical cluster with 1: C57Bl6 vs. alb-SREBP-1a, 2: C57Bl6 vs. alb-SREBP-1a∆P, and 3: alb-SREBP-1a vs. alb-SREBP-1a∆P.


