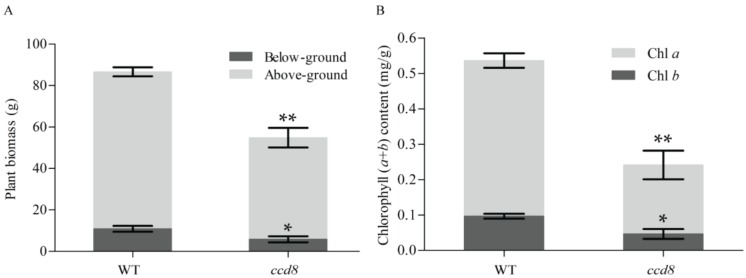
Figure 6.
Plant biomass and chlorophyll content in wild-type and ntccd8 mutant plants. (A) Dry weight of root and aerial tissue in 50-day-old wild-type and mutant plants. Data are the means ± SD (n = 3). (B) Quantification of total chlorophyll (Chl a and Chl b) in four-month-old plants leaves (n = 3 for wild-type and mutant plants). The asterisks indicate statistically significant differences compared to wild-type plants (* p < 0.05 and ** p < 0.01; Student’s t-test).

