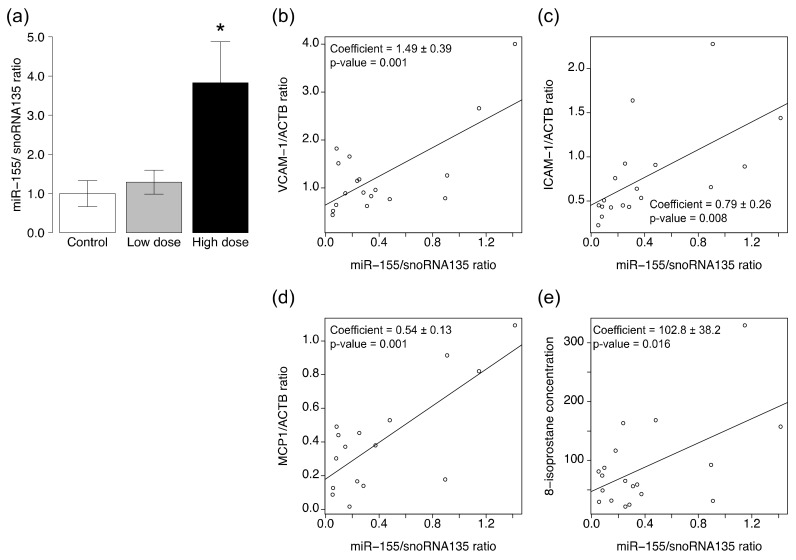
Figure 4.
Expression levels of miRNAs in ApoE KO mice exposed to CS. The levels of (a) miR-155 in the aortic tissues were determined by quantitative RT-PCR analysis. Data are normalized by the abundance of snoRNA135. Quantitative data are expressed relative to the values for the control group. Data are mean ± SEM of six or seven animals per group. * p < 0.05 versus the control group. The scatter plots showing the correlation between expression levels of miR-155 and (b) VCAM-1; (c) ICAM-1; (d) MCP1; and (e) creatinine adjusted level of 24-h urinary 8-iso-prostaglandin F2α. The coefficients and p-values were shown in the plots.

