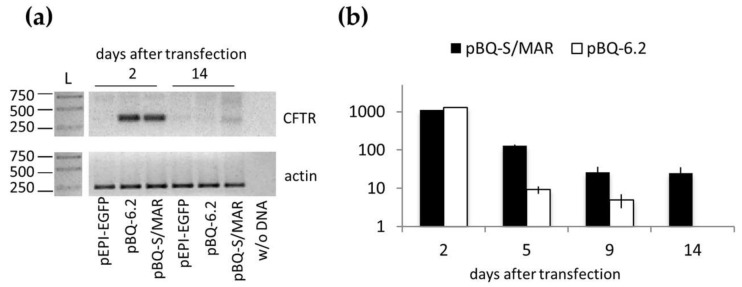
Figure 3.
CFTR expression in CFBE cells. (a) Reverse transcription-PCR for wt CFTR (upper panel) and β-actin (lower panel) of CFBE cells transfected with the indicated vector propagated for 2 and 14 days after transfection. Samples were separated by agarose gel electrophoresis in 1.5% agarose gels; L, ladder (band size is in bp). (b) CFTR mRNA relative quantification (RQ) in the indicated samples. RQ (mean ± SD, n = 2, each in duplicate) was determined by the ΔΔCt method using parental CFBE cells as calibrator.

