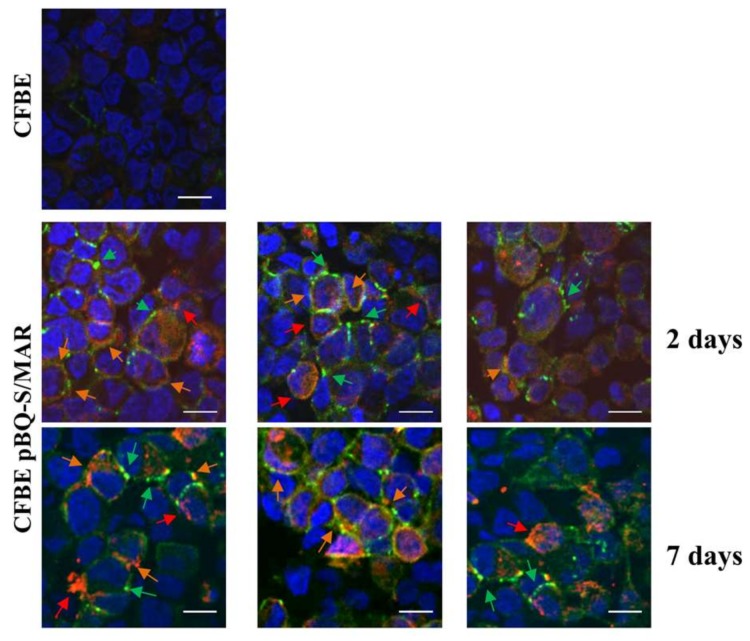
Figure 6.
CFTR localizes to the apical membrane in pBQ-S/MAR transfected cells. Cells propagated for 2 or 7 days after transfection were seeded on filters, maintained in ALI conditions for 9 days and probed with anti-CFTR and anti-ZO1 antibodies. At that time the average TER values were 280 Ω·cm2 with no significant variations among filters. Secondary antibodies were: green for ZO1, red for CFTR. Nuclei were counterstained with DAPI (blue). Red and green arrows point to CFTR and ZO1 signals, respectively; orange arrows indicate co-localization of red and green spots. Scale bar, 10 μm.

