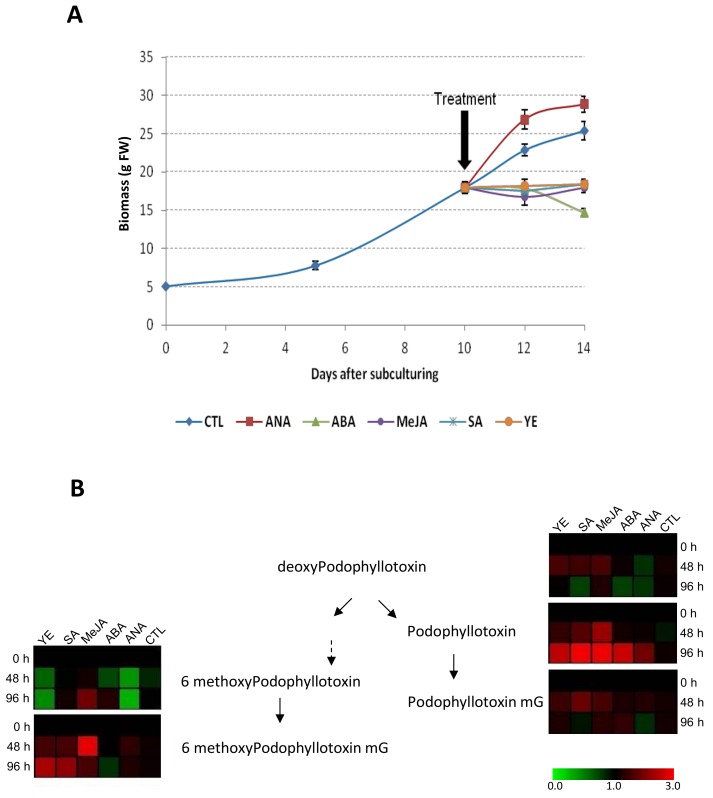
Figure 5.
Impact of phytohormones and elicitors treatments on the growth and ATL accumulation profiles of HRLF15.2 line. (A) Growth curves of HRLF15.2 line treated with NAA (1 mg/mL), ABA (100 µM), MeJA (100 µM), SA (100 µM) or YE (3% w/v); (B) Relative impact of NAA (1 mg/mL), ABA (100 µM), MeJA (100 µM), SA (100 µM) or YE (3% w/v) treatments on the intracellular accumulation kinetic of the main ATL and their glucosylated forms in HRLF15.2 line. Detailed ATL accumulation kinetics are presented in Figure S3. Each point is the mean and standard deviation of the three independent experiments.

