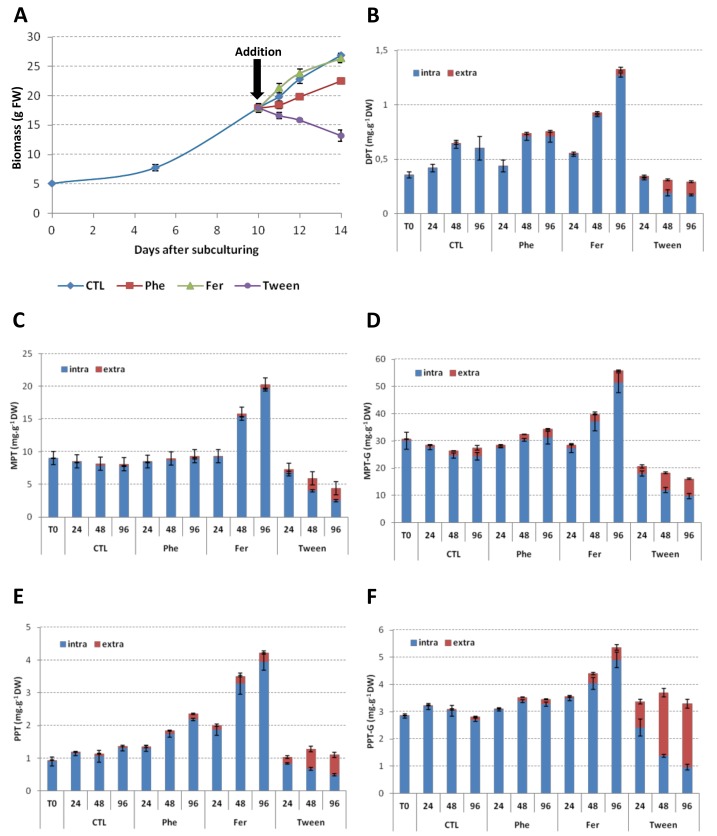
Figure 6.
Impact of precursors feeding and permeation on the growth and ATL accumulation profiles of HRLF15.2 line. (A) Growth curves of HRLF15.2 line fed with l-Phe (1 mM) or ferulic acid (1 mM) or treated with Tween-20 (2% w/v); (B) Impact of l-Phe (1 mM) or ferulic acid (1 mM) or Tween-20 (2% w/v) addition on the intracellular and extracellular accumulation kinetic of DPT in HRLF15.2 line; (C) Impact of l-Phe (1 mM) or ferulic acid (1 mM) or Tween-20 (2% w/v) addition on the intracellular and extracellular accumulation kinetic of MPT in HRLF15.2 line; (D) Impact of l-Phe (1 mM) or ferulic acid (1 mM) or Tween-20 (2% w/v) addition on the intracellular and extracellular accumulation kinetic of MPTG in HRLF15.2 line; (E) Impact of l-Phe (1 mM) or ferulic acid (1 mM) or Tween-20 (2% w/v) addition on the intracellular and extracellular accumulation kinetic of PPT in HRLF15.2 line; (F) Impact of l-Phe (1 mM) or ferulic acid (1 mM) or Tween-20 (2% w/v) addition on the intracellular and extracellular accumulation kinetic of PPTG in HRLF15.2 line. Data on l-Phe or ferulic acid uptakes are presented Figure S4. Each point is the mean and standard deviation of the three independent experiments.

