
Figure 3.
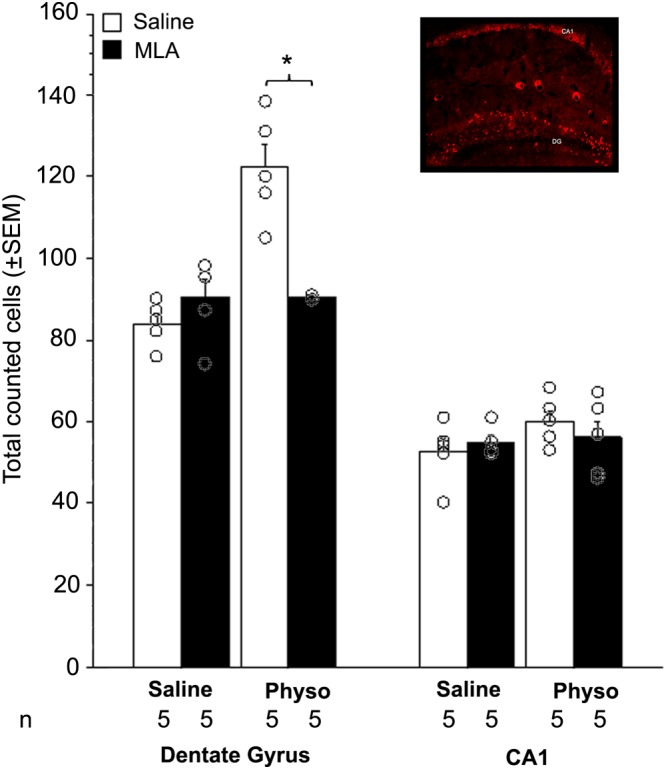
c‐fos immunohistochemistry in the hippocampus after systemic MLA treatment. Total number of counted cells in the DG (left) and the CA1 field (right) of the hippocampus in C57BL/6J male mice following injection of MLA (5 mg·kg−1, i.p.) with or without physostigmine (Physo: 0.15 mg·kg−1). Data are expressed as means ± SEM, and dots represent each individual animal; n = 5 mice per treatment group (sum of left and right hippocampi combined). Inset represents an example of c‐fos immunohistochemistry in the hippocampus. *P < 0.05, significantly different as indicated; ANOVA and post hoc t‐test with Bonferroni correction.