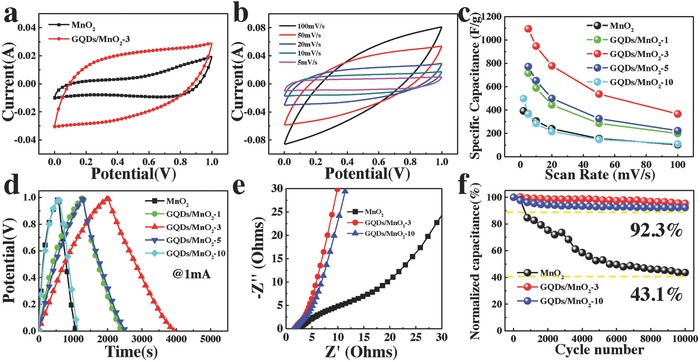
Figure 4.

CV curves of MnO2 and GQDs/MnO2‐3 at a scan rate of 20 mV s−1. b) CV curves of GQDs/MnO2‐3 at different scan rates (5–100 mV s−1). c) Specific capacitances of all samples as a function of the scan rate. d) GCD curves of all samples at current of 1 mA. e) Nyquist plots in a frequency range from 0.01 Hz to 100 kHz for all samples. f) Cycling stability tests over 10 000 cycles for MnO2, GQDs/MnO2‐3, and GQDs/MnO2‐10.
