
Figure 1.
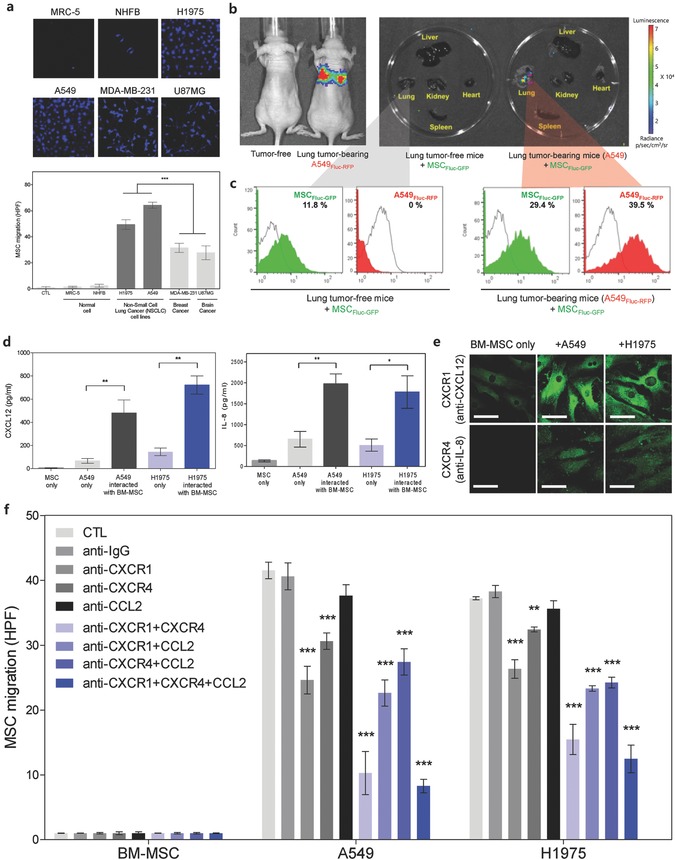
BM‐MSCs homing to lung cancer, and determination of homing‐related cytokine receptors on MSCs. a) Differential in vitro tropism toward various cancer cells based on MSC lineages. Inset images are the representative confocal images of the transwell migration of BM‐MSC toward normal and cancer cells (i.e., lung, breast, and brain cancer). BM‐MSCs showed accelerated homing ability toward human lung cancer cells (e.g., H1975 and A549). Data represent mean ± standard error of the means (SEM) (n = 10). b) Bioluminescence image (left) of tumor‐free mice and lung tumor‐bearing (A549Fluc–RFP) mice. Ex vivo imaging (right) of major organs (liver, lung, kidney, heart, and spleen) harvested from tumor‐free and lung tumor‐bearing (A549) mice at 3 d after the intravenous injection of MSCFluc–GFP. Tissues were imaged within 3 min of explanting. c) FACS histogram analysis shows increased percentage of MSCFluc–GFP in A549Fluc–RFP tumor bearing mice compared to tumor free mice (in the lung tissue) after 2 d of the intravenous injection of MSCFluc–GFP. d) Detection of chemokines (CXCL12 and IL‐8) secreted from A549 and H1975 lung cancer cells when co‐cultured with BM‐MSCs. CXCL12 and IL‐8 chemokine levels quantitated by ELISA. Data represent mean ± SEM (n = 3), *p < 0.05 and **p < 0.01 versus A549 cells (48 h). e) Confocal images represent phenotypic expression of MSC cytokine receptors (CXCR1 and CXCR4) in response to CXCL12 and IL‐8 secreted from A549 and H1975. f) BM‐MSC migration toward lung cancer cells (A549 and H1975) after blocking chemokine receptors on the MSC surface. MSCs were cotreated with anti‐CXCR1, anti‐CXCR4, and anti‐CCL2 Abs. MSC migration toward lung cancer cells (both A549 and H1975) diminished after the blocking of CXCR1 or CXCR4. Data represent mean ± SEM (n = 10), and the p value reference was CTL.