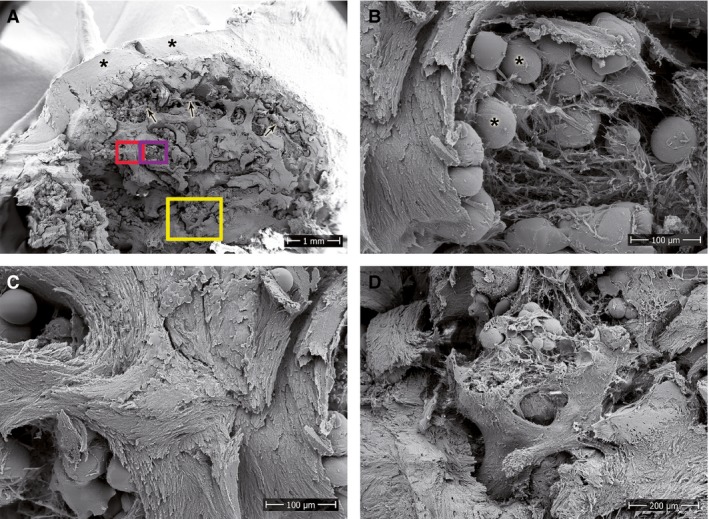
Figure 2.

SEM of the proximal pole of a long‐standing SNU. (A) Overview image showing an outer cartilage layer (asterisks), abundant subchondral fat deposits (arrows) and an overall degeneration of the bone tissue. Rectangular areas highlight the location of the magnified images. (B) Fat deposits (asterisks) within loosely organised fibres of connective tissue. (C) Undirected orientation and (D) spongy degeneration of the trabeculae. Scale bars: 1 mm (A), 100 μm (B,C), 200 μm (D).
