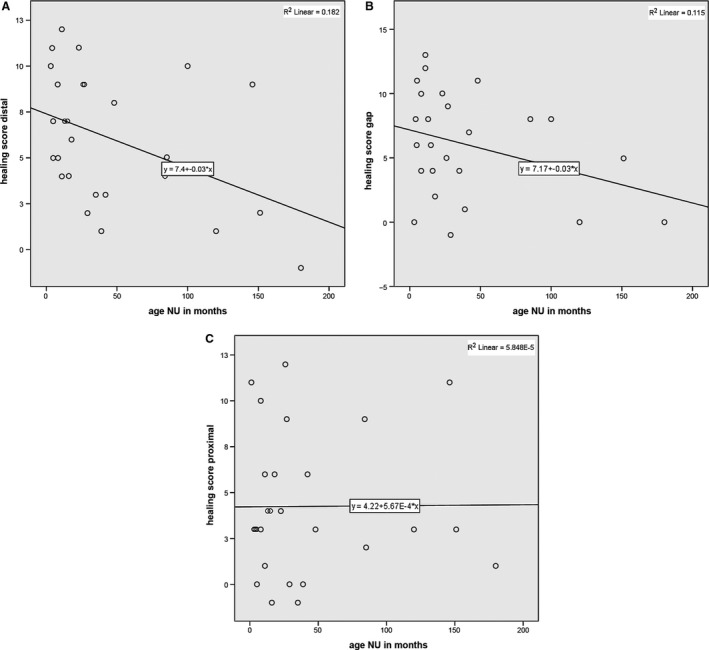
Figure 4.

(A) Scatter plot of healing activity score of the distal fragment vs. time from initial fracture with regression line (y = 7.4 − 0.03*x) and R 2 (R 2 = 0.182). (B) Scatter plot of healing activity score of the gap section vs. time from initial fracture with regression line (y = 7.17 − 0.03*x) and R 2 (R 2 = 0.115). (C) Scatter plot of healing activity score of the proximal part vs. time since initial fracture; no correlation or change over time is visible.
