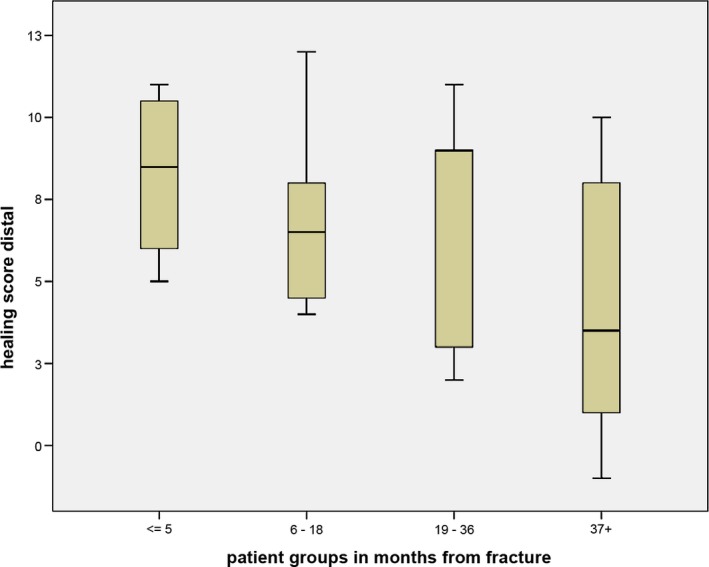
Figure 5.

Box plot of healing activity score from the distal pole grouped by time since fracture. Central lines in each box denote the median, the lower/upper rims represent first/third quartiles and the whiskers extend to the minimum/maximum values.
