Figure 2.

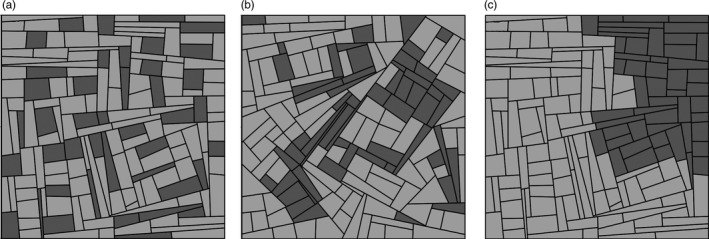
Simulated landscapes with 30% of the crop being represented by the resistant cultivar and an increasing aggregation level (a: low; b: intermediate; c: high)

Simulated landscapes with 30% of the crop being represented by the resistant cultivar and an increasing aggregation level (a: low; b: intermediate; c: high)