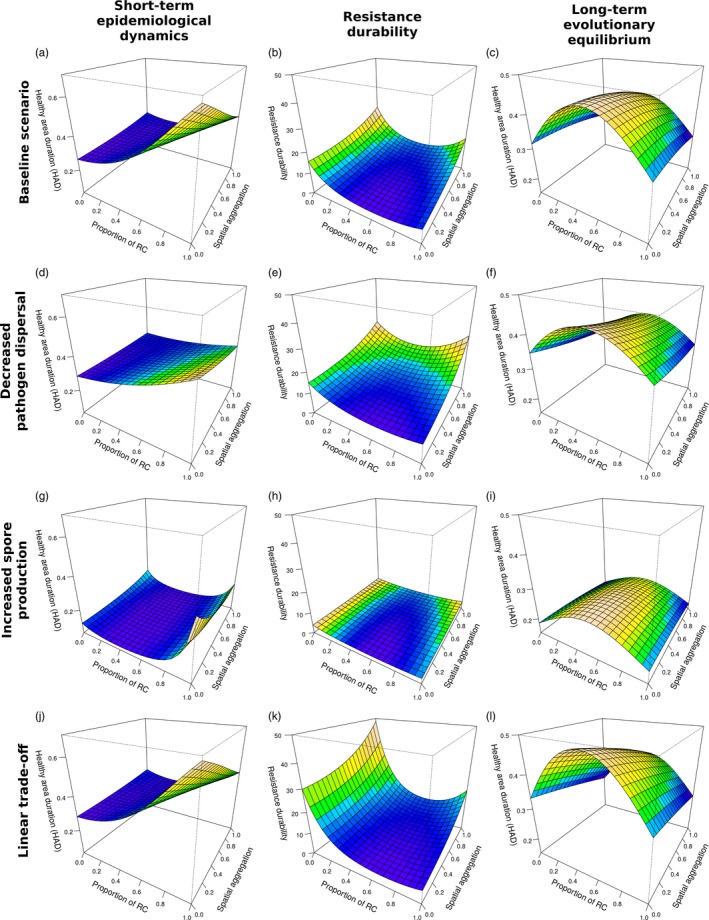
Figure 3.

Relationship between landscape organization (proportion of the resistant cultivar and spatial aggregation) and the three model outputs based on the computation of the healthy area duration (HAD—a, d, g and j, short‐term epidemiological dynamics; b, e, h and k, resistance durability; c, f, i and l, long‐term evolutionary equilibrium). A baseline scenario (a, b and c—values of parameters: β = 0.8, r = 5 and ) is compared to a scenario with decreased pathogen dispersal (d, e and f—values of parameters: β = 0.8, r = 5 and ), with increased spore production (g, h and i—values of parameters: β = 0.8, r = 10 and ) and with a linear trade‐off (j, k and l—values of parameters: β = 1, r = 5 and )
