
Figure 7.
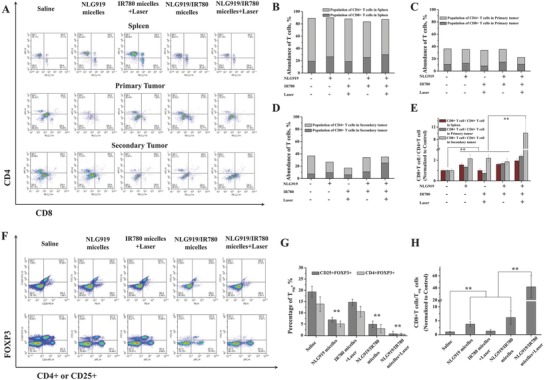
The mechanism study. Representative flow cytometry plots showing A) CD4+ T cells and CD8+ T cells in spleen, primary tumors, and secondary tumors 16 d after the treatments. B–D)The populations of CD4+ and CD8+ T cells in the tumors after different treatments. E) The ratios of CD8+ T cells/CD4+ T cells in spleen, primary tumors, and secondary tumors. Tumor cell suspensions were analyzed by flow cytometry for T‐cell infiltration (gated on CD3+ T cells). Populations of tumor‐infiltrating T cells (CD4+ T cells, CD8+ T cells and CD8+/CD4+) in primary tumors upon various treatments (C). F) The populations of regulatory T cells (Treg, CD25+CD4+FOXP3+) in the spleens after various treatments. G) The percentage of Treg in spleens. H) The ratios of CD8+ T cells/Treg. **p < 0.01.