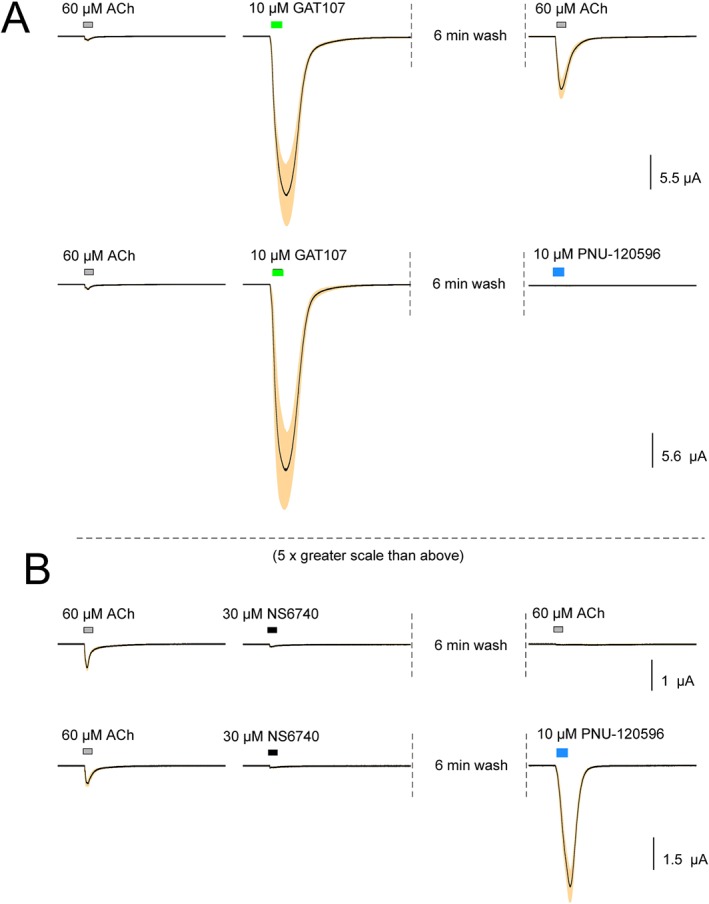
Figure 2.

Averaged data showing the responses to GAT107 and NS6740 and the modulation of subsequent responses to ACh or a PAM. (A) Data from voltage‐clamped oocytes showing initial ACh control responses and then the direct allosteric activation by GAT107. Data for each cell were normalized to the average of the peak current amplitude of two initial ACh controls, which are shown to provide scale. The solid lines are the averages (n = 7), and the shaded areas are the standard errors of the mean for each of the 10 322 points (see Methods). Each trace segment is 206.44 s long, and the interval between traces is 16.56 s. After the acquisition of the GAT107 response data, cells were washed for an additional 6 min before the application of either 60 μM ACh or 10 μM PNU‐120596. Control ACh responses were 894 ± 129 and 779 ± 98 nA for the upper and lower traces respectively. (B) The data from oocytes, processed as described above, illustrating responses to 30 μM NS6740 and, following a 6 min wash, the application of either 60 μM ACh or 10 μM PNU‐120596. Control ACh responses were 804 ± 98 and 854 ± 212 nA for the upper (n = 7) and lower trace (n = 8) respectively. The amplitudes of the ACh controls were similar for other experiments. Note the difference in scale of the presentation between panels A and B. Vertical scale bars are based on averaged ACh controls.
