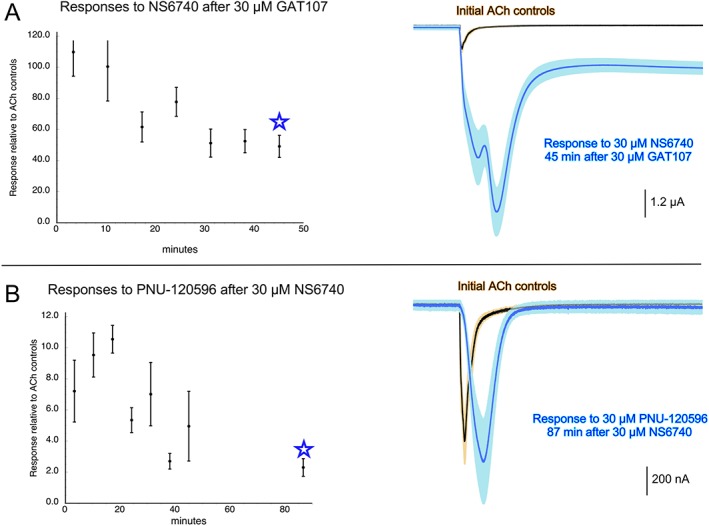
Figure 3.

Duration of GAT107 and NS6740 effects on α7 nAChR responses. Groups of cells expressing human α7 AChRs were given two control applications of 60 μM ACh prior to single 12 s applications of either 30 μM GAT107 (A) or 30 μM NS6740 (B). Cells were continuously perfused with Ringers for varying periods of time and then probed with single applications of 30 μM NS6740 (A) or 30 μM PNU‐120596 (B). Peak current responses evoked by the probe applications were normalized to the initial responses to 60 μM ACh, which in these experiments averaged 930 ± 70 nA. For all points in the plots, n ≥ 5 cells. Traces displayed on the right are the averaged raw data for the eight cells in (A) and the seven cells in (B) that were obtained at the long wash times tested for each condition (indicated by the stars). They are compared with the averaged ACh responses obtained prior to the initial applications of GAT107 (A) or NS6740 (B). Each trace segment is 206.44 s long. Vertical scale bars are based on averaged ACh controls.
