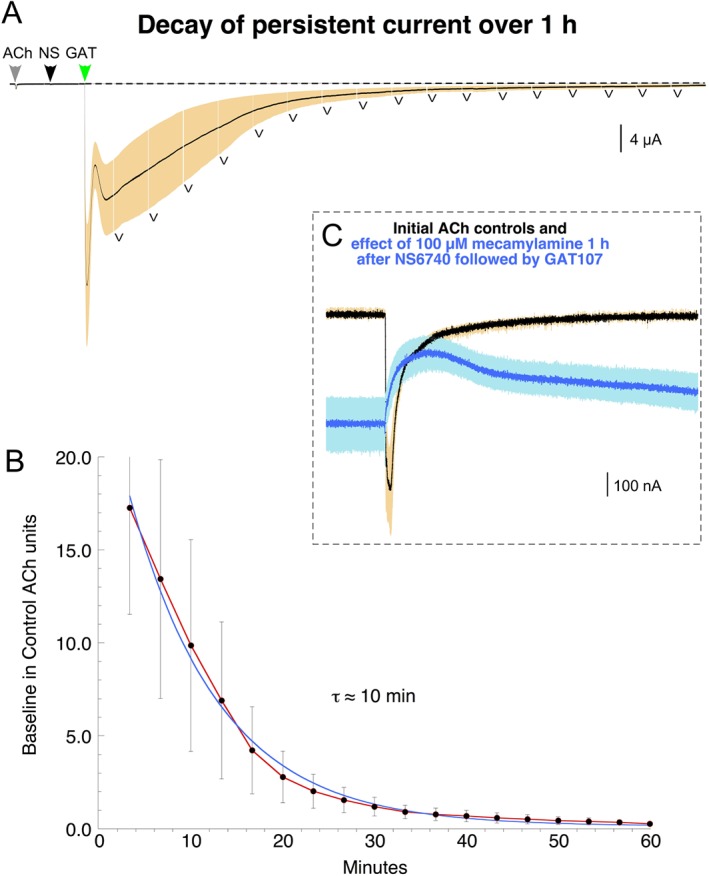
Figure 5.

Decay of persistent current activated by GAT107 after NS6740. The upper trace shows the averaged response of four cells to a control 60 μM ACh application followed by 30 μM NS6740 and μM GAT104 (see Methods). During the subsequent periods of washout following the peak of the GAT107 activated current, data were sampled for 30 s at the beginning of every episode (223 s intervals), as indicated by the ‘v’ symbols below the trace and the mean values calculated and normalized to the respective ACh controls. These are plotted (red line ± S.E.M) and fit (blue line) with an exponential function that had a time constant of 10 ± 0.5 min and a correlation coefficient of 0.99716. The inset shows the effect of an application of 100 μM mecamylamine after 1 h of wash compared with the ACh controls and original baseline. Vertical scale bars are based on averaged ACh controls.
