
Figure 7.
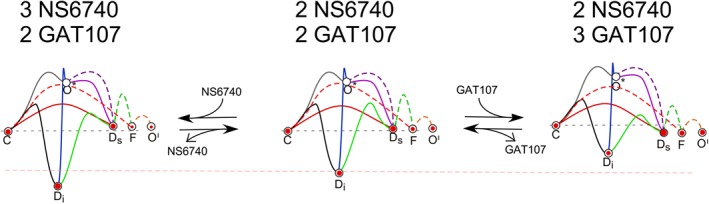
Hypothetical changes in the energy landscapes for α7 state transitions at differing levels of NS6740 and GAT107 binding. Shown in the centre is the landscape for occupancy of the S site and the P site from Figure 6, which assumes an intermediate level of binding at both sites. The left‐ and right‐most models hypothesize what might be changing with additional applications of either NS6740 or GAT107 respectively. These models are discussed in the text regarding the dynamic changes in currents shown in Figure 4C, D. The pink dashed line is provided to reference the starting energy for the Di state in the centre landscape for comparison to the other landscapes. Also shown in the centre landscape is hypothetical occupancy of the states relative to each other for a population of receptors during the phase of persistent current prior to another drug application, indicated by the size of the enclosed red dots. As shown, the occupancy of the states by the receptors in the population is assumed to shift following a drug application, favouring transitions among the states where the energy barriers have been reduced.