Figure 1.

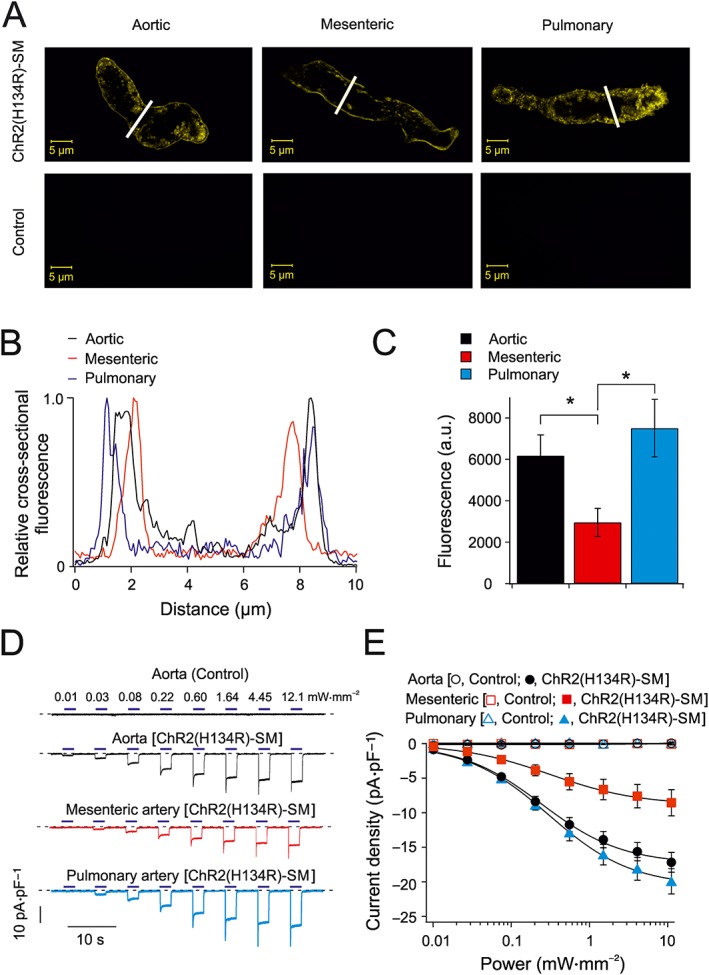
Expression of ChR2(H134R) channels and current density in isolated VSMCs. (A) Representative confocal images of freshly isolated aortic, mesenteric and pulmonary VSMCs obtained from control and ChR2(H134R)‐SM mice, as indicated. Similar fluorescence distribution was observed in cells obtained from a total of five mice. (B) Normalized fluorescence intensity of cell cross sections of aortic, mesenteric and pulmonary VSMCs (cross‐section location indicated by white bars in A). (C) Average fluorescence density of aortic (N = 5, n = 61), mesenteric (N = 5, n = 49) and pulmonary artery (N = 5, n = 64) VSMCs isolated from ChR2(H134R)‐SM. (D) Whole‐cell currents recorded from aortic, mesenteric and pulmonary artery VSMCs isolated from control and ChR2(H134R)‐SM mice, as indicated. Currents were recorded at −80 mV. VSMCs isolated from control and ChR2(H134R)‐SM mice were exposed to periods (2 s) of blue light of various intensities, as indicated by the horizontal blue bars. The dashed lines represent the level of current in the absence of light stimulation. (E) Mean current density versus blue light intensity relationships for VSMCs obtained from control aortic (N = 5, n = 5), mesenteric (N = 5, n = 10) and pulmonary artery (N = 5, n = 6) VSMCs or ChR2(H134R)‐SM aortic (N = 10, n = 18), mesenteric (N = 6, n = 16) and pulmonary artery (N = 7, n = 23) VSMCs. The curves through the open symbols (control) were drawn by the eye. The curves through the filled symbols represent the best fit of the data with Equation (1). * P < 0.05, significantly different as indicated; one‐way ANOVA.
