Figure 2.

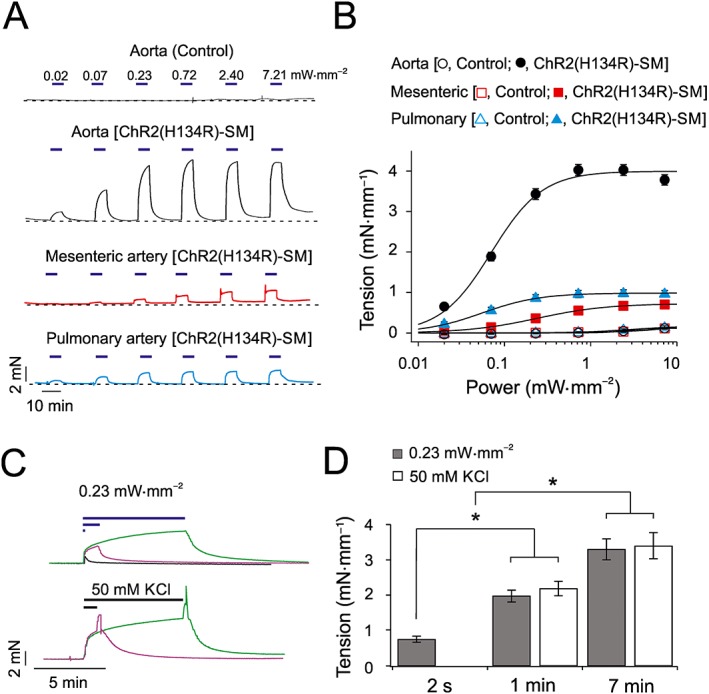
Effects of blue light on the tension of isolated artery rings. (A) Isometric tension recordings obtained from aortic, mesenteric and pulmonary artery rings isolated from control and ChR2(H134R)‐SM mice, as indicated. Artery rings were exposed to periods (7 min) of blue light of various intensities, as indicated by horizontal blue bars. Dashed lines represent baseline tension level. (B) Mean tension versus blue light intensity relationships for (i) control aortic (N = 5, n = 10), mesenteric (N = 5, n = 6) and pulmonary artery (N = 5, n = 6) rings or (ii) aortic (N = 32, n = 36), mesenteric (N = 10, n = 15) and pulmonary artery (N = 5, n = 9) artery rings obtained from ChR2(H134R)‐SM mice, as indicated. The curves through open symbols (control) were drawn by the eye. The curves through the filled symbols represent the best fit of the data with Equation (5). (C) Isometric tension recordings obtained from isolated aortic rings in response to periods of exposure to blue light (0.23 mW·mm−2) of different durations (2 s, 1 min and 7 min) or periods of exposure (1 or 7 min) to PSS supplemented with 50 mM KCl, as indicated by the horizontal bars. Traces are represented in different colours for clarity. (D) Mean tension developed by isolated aortic rings in response to 0.23 mW·mm−2 blue light or 50 mM KCl for periods of different duration (N = 5, n = 10 in each case). * P < 0.05, significantly different as indicated; one‐way ANOVA.
