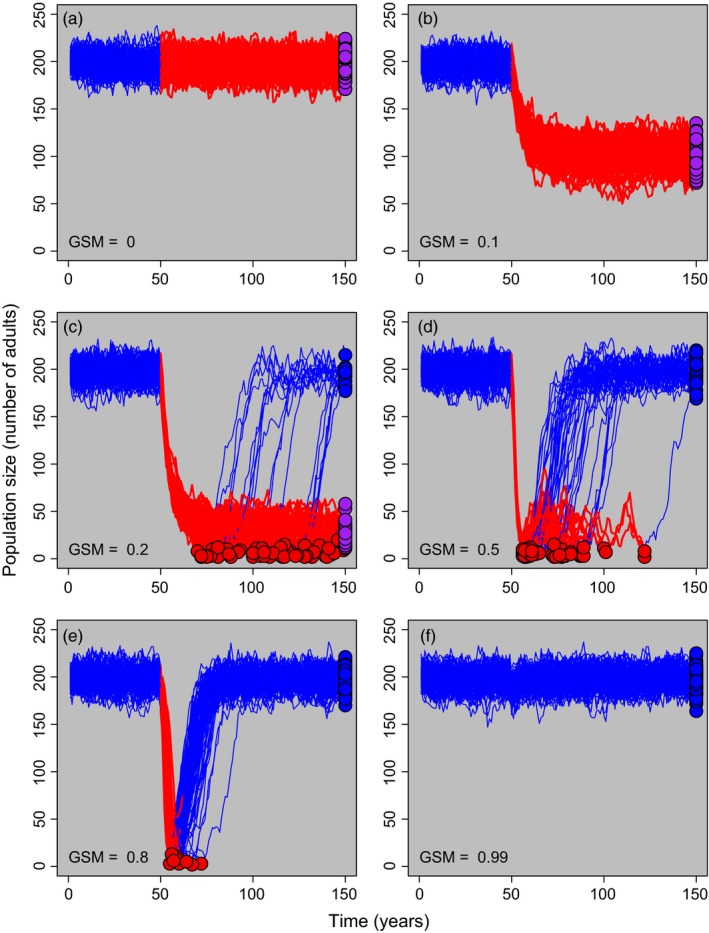
Figure 3.

Host population size (number of adults) through time for six different values of genotype‐specific mortality (GSM; indicated in the bottom left of each panel) when all individuals within the population have the same GSM. Each line represents a single model run. Bd was introduced into the population in year 50. Blue lines represent uninfected host populations while red lines represent populations with at least one infected individual. Dots represent the population outcome where red points (jittered) show host populations that went extinct, blue points show host populations that cleared infection, and purple points illustrate host populations that coexisted with infection. Model parameters were set to default values (K adults = 200, K tads = 1,000 and moderate transmission as in Figure 2b)
