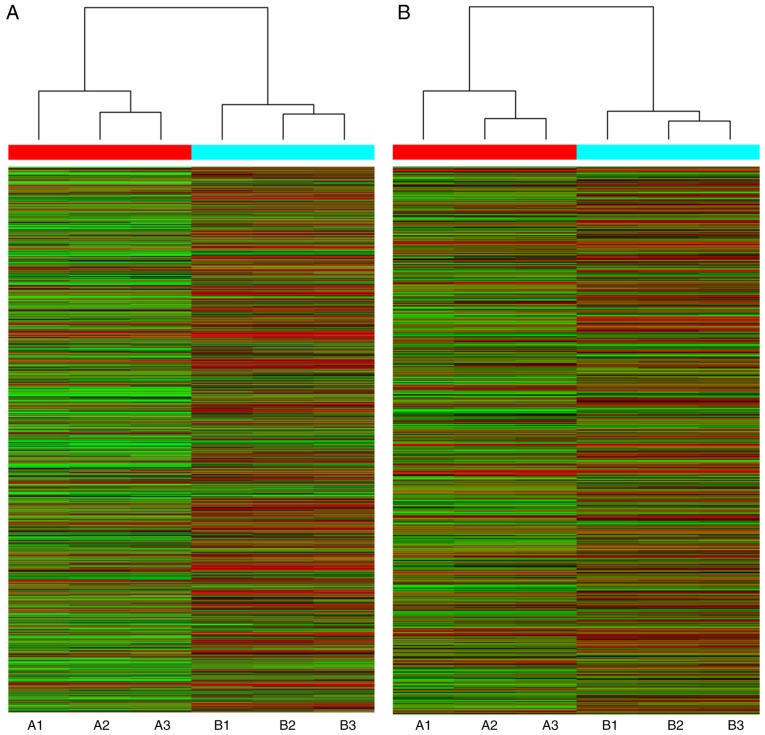
Figure 2.
Heat map and hierarchical clustering. Cluster analysis arranges samples into groups based on their expression levels. This analysis was performed to examine distinguishable (A) long non-coding RNA and (B) mRNA expression patterns among the samples. In the dendrogram, red indicates high relative expression and green indicates low relative expression. A1-A3 represent high-grade ovarian serous cancer tissue samples. B1-B3 represent healthy fallopian tube tissue samples.

