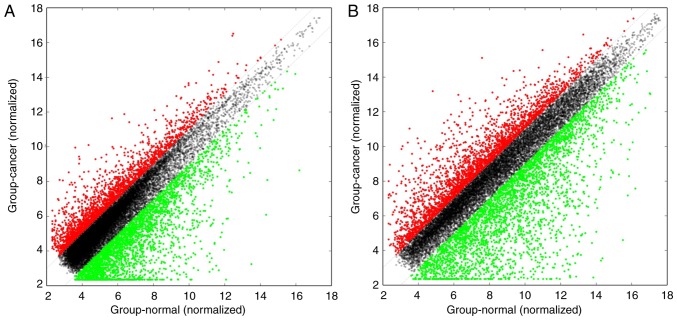
Figure 3.
Scatter plots were used to assess variation in (A) long non-coding RNA and (B) mRNA expression between the two groups. The values plotted on the X and Y axes are the averaged normalized signal values in each group (log2 scaled). Red points in the plot indicate >2.0-fold upregulation of expression between the two groups, green points indicate >2.0-fold downregulation of expression, and black points indicate <2.0-fold change in expression.

